Have you wondered if there’s nitrate in your irrigation water? In Wisconsin, most commercial vegetables require irrigation to sustain yield, yet nitrogen in irrigation is often not credited as a source of nitrogen input. In this article, we will discuss the presence of nitrate in irrigation water and opportunities to budget nitrogen in irrigation, to make farms more efficient in using nitrogen and reduce over-fertilization which in turn will protect groundwater.
Nitrogen in irrigation water
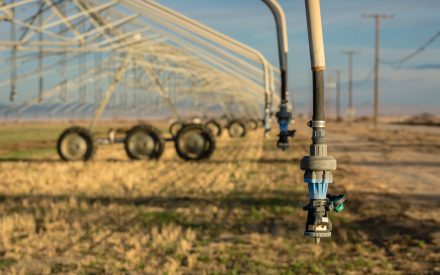
Nitrogen in groundwater is present in the form of nitrate. On commercial vegetable farms with coarse-textured soils, high-capacity groundwater pumping wells are commonly used for irrigation. As a result, nitrate-N in groundwater re-enters the nitrogen cycle in irrigated fields through irrigation. In Figure 1, irrigation N, like other nitrogen inputs including N from fertilizer and manure, can add nitrogen to the soil nitrogen pool.
Figure 1: Nitrogen cycle in an irrigated cropping system. Adapted from “The Nitrogen Cycle for general cropping systems” by Nutrient and Pest Management Program at UW-Madison.
In 2020, a survey of six farms in the Wisconsin Central Sands region conducted by Dr. Chris Kucharik and Tracy Campbell from the Department of Agronomy at UW-Madison found NO3-N levels ranging from 4 to 45 mg/L in irrigation wells. The level of nitrogen from the same wells remains relatively stable year to year, even though it can vary from well to well. To determine nitrogen levels in your irrigation water, test different wells annually.
How to calculate
You can calculate the amount of nitrogen from irrigation through the following formula:
Irrigation N (lb N/ac) = Irrigation amount (inches) * Irrigation water NO3-N concentration (mg/L)* 0.23
For every inch of irrigation water containing 10 mg/L of NO3-N, 2.3 pounds of nitrogen per acre is added through irrigation. The amount of irrigation N varies across wells with different nitrate-N levels and crops with different water needs. The table below presents nitrogen applied through irrigation for several typical common vegetable crops grown in the Central Sands.
| Crop | Seasonal total irrigation (in) | Irrigation NO3-N (mg/L) | Irrigation N addition (lbs N/acre) |
| Potato | 14 | 20 | 64 |
| Sweet Corn | 7 | 20 | 32 |
| Pea | 4 | 20 | 18 |
Table 1: Irrigation N from typical common vegetable cropping systems in central Wisconsin. Irrigation NO3-N concentration used here are averages measured in the Central Sands region.
Considering nitrogen from irrigation can optimize your crop production. In Table 1, potatoes typically require 10-14 inches of irrigation water to prevent reduced yield and quality caused by water stress. With 14 inches of irrigation water containing 20 mg/L of NO3-N, 64 pounds of nitrogen per acre can be added. For peas and green beans with the 4-7 inches of irrigation water with the same nitrate-N concentration, 20-30 pounds of nitrogen can be added through irrigation. As a result, failing to include irrigation nitrogen can lead to the risk of over-fertilization.
Applying nitrogen fertilizer according to crop needs reduces the potential for groundwater nitrogen leaching, especially in well-drained soils. For example, over-fertilization increases nitrogen leaching potential exponentially while yield plateaus in potatoes (Figure 2). After crop N demand is met, excessive fertilizer nitrogen will likely leach to the groundwater. This is why it is important to take into account all sources of nitrogen, including from irrigation.
Figure 2: As fertilizer N rate increases, potato yield plateaus while leachable N exponentially rises. Data of yield response to fertilizer from Ruark & Zegler (2018). Leachable N calculated through Nitrate Leaching Calculator, developed by Kevin Masarik from University of Wisconsin-Stevens Point.
N in irrigation and irrigation scheduling
Adjusting fertilization N rates requires evaluating irrigation scheduling and crop N demand first. In this article, we will use examples of potato production on coarse-textured soils to illustrate N addition from irrigation water during the growing season.
1. Calculate the overall N additions from irrigation during the growing season
UW’s current N rate recommendation considers the amount of nitrogen within irrigation water. However, since nitrate-N in irrigation water varies from well to well and amount of irrigation varies from year to year, it is important to understand nitrogen from your individual wells to plan nutrient applications more mindfully.
Figure 3 presents a typical irrigation plan within potato production systems in the Wisconsin Central Sands region. In this example, an average of 1.7 pounds of N per acre was applied via irrigation every three to four days. Over the entire growing season, 64 pounds of nitrogen was added through 14 inches of irrigation water with a N concentration at 20 mg/L, and close to 80 pounds of nitrogen was added via 19 inches of irrigation in a dryer season.
3a)
3b)

Figure 3: Irrigation and rainfall amount of an average to wet potato season (3a), and a dry season (3b). The cumulative irrigation N curve shows that irrigation N accumulates during the growing season (orange line). Rainfall was also plotted as gray columns in both charts. Total rainfall in 3a was 17 inches, and 9 inches in 3b.
2. Adjust individual N application rates by accounting for the irrigation N addition
By comparing the N from irrigation and fertilizer (Figure 4), you can gain insights on opportunities to optimize fertilizer use. In Figure 4a, after the last fertigation on 7/28, 23 pounds of N were added through irrigation, while crop N uptake slows down in late season generally. Therefore, account for irrigation N addition from previous events to optimize fertilizer N rates.
In a dryer summer, the total N from irrigation becomes more significant due to frequent irrigation scheduling. Let’s compare two scenarios: a season with 17 inches of rain (Figure 4a) and a dryer season with 9 inches of rainfall (Figure 4b). Irrigation amount difference between the two seasons is 5 inches. A difference of 5 inches of irrigation water at a 20 mg/L of N concentration adds an extra 23 pounds of N per acre. As a result, more frequent irrigation due to dryer weather provides greater opportunities to optimize in-season fertilizer use by following UW recommendation rates.
Figure 4a: A comparison of irrigation nitrogen addition with cumulative nitrogen input throughout a typical potato growing season. This example includes the application of 17 inches of irrigation water with a NO3-N concentration of 20 mg/L. The graph also shows seven nitrogen fertilizer applications (red bars), including three sidedressing and four fertigation events. The cumulative irrigation nitrogen addition (blue line) demonstrates that irrigation continuously adds nitrogen throughout the growing season. The cumulative nitrogen input (orange line) is calculated by combining fertilizer application amounts and irrigation nitrogen amounts. Note that in this example, the amount of nitrate, which may leach after heavy rainfall was not accounted for.
Figure 4b: In contrast to Figure 4a, which represents an average to wet year (17 inches of rainfall), this graph shows the irrigation nitrogen addition for potato production in a dry year (9 inches of rainfall). The annotation remains the same as in Figure 4a. By the end of the season, potential to use N in irrigation reaches close to 80 lbs N/acre.
Using N in irrigation as part of the nutrient management plan requires more research. We need to investigate the realistic credit irrigation N offers in different cropping systems on various soil types. Also, during a growing season, it is challenging to reduce nitrogen fertilization rate due to unpredictable irrigation needs under variable weather. The exercise presented in this article currently serves as a tool to help hindcast nitrogen addition from irrigation.
For most growers in Wisconsin, considering nitrogen addition from irrigation is a new concept. It’s important to be aware that fertility not only comes from fertilizer bags, but also may come from irrigation water.
Here are some recommendations to think about nitrogen addition from irrigation:
- Test nitrate concentration in water from multiple irrigation wells: To accurately quantify the nitrogen addition from irrigation, conduct annual or biennial testing of nitrate levels in water from each well used to supply irrigation water. Take water samples from irrigation wells at or after the second irrigation event to avoid biases. This will help you understand the variability of nitrogen levels and make informed decisions regarding nitrogen management.
- Budget and reflect on N content in irrigation water: This hindcast approach offers an opportunity to optimize N use to crop needs, and minimize nitrogen leaching to groundwater, particularly in well-drained soils.
Resources
Research report with irrigation nitrate-N content in Wisconsin Central Sands from six farms.
Chris Kucharik & Tracy Campbell. “Improving water and nitrogen use efficiency under changing weather variability in the central sand.” https://www.wri.wisc.edu/wp-content/uploads/WR18R001.pdf
Potato nitrogen rate and form trials conducted by researchers from the Department of Soil Science at UW-Madison. Matt Ruark & Chelsea Zegler. 2018. “Review and Reassessment of enhanced efficiency fertilizer for potato production”. https://wpvga.conferencespot.org/event-data/pdf/a157/fl015
Recommendations on calculating nitrogen credit from University of Minnesota Extension: Vasudha Sharma. “How to calculate a nitrogen credit from irrigation water.” https://blog-crop-news.extension.umn.edu/2021/07/how-to-calculate-nitrogen-credit-from.html

 ▶Watch: Optimizing nitrogen use and reducing nitrate leaching
 A cost-effective approach for on-farm tile monitoring
 Weighing the impacts of tile drains on nutrient losses
 ▶ Watch: Nitrogen leaching in central sands: Regional & field-based estimation


