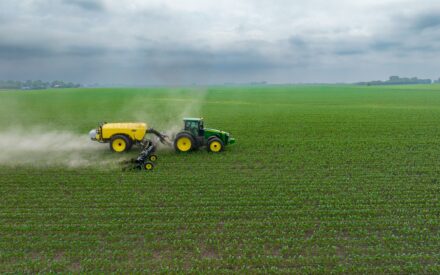
In April 2026, commercial nitrogen (N) fertilizer prices increased approximately 30% since fall 2025. Fortunately, there are nutrient management choices farmers can make to minimize financial impacts of this sudden price increase.
1. Identify a Cost-Effective N Rate
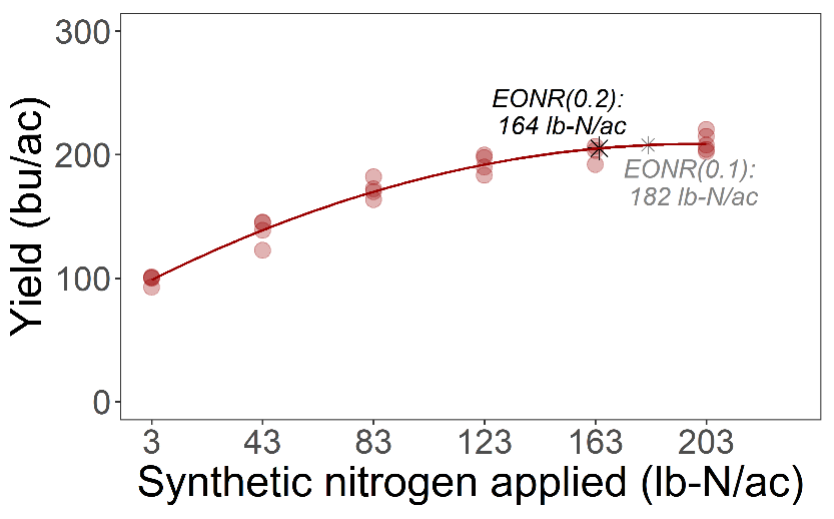
UW–Madison (UW) corn N rate guidelines are based on the Maximum Return to Nitrogen (MRTN) approach. This uses the ratio between anticipated corn price ($/bushel) and cost of commercial N ($/lb N). These guidelines help farmers maximize economic return on planned corn nitrogen fertilizer applications. Currently, the N:corn price ratio is 0.20, which is double the average rate over the past 10 years. This doubling of the MRTN ratio results in suggested corn N application rates that are 20 to 30 pounds/acre lower to reflect reduced profit potential from increased fertilizer costs.
Use the UW Crop Enterprise Budget Tool to help make crop management decisions that considers factors other than the fertilizer application rates. This tool estimates the cost of production for nine different crops and the overall profit potential of these crops. Users can enter revenue and expense information specific to their farm operation to receive a detailed analysis. The tool also provides a yield and price sensitivity analysis when yield and prices change up to 20% and adjusts net return per acre.
2. Account for On-Farm Nitrogen Sources
Manure and rotated legumes (i.e. alfalfa or clovers) are significant sources of N for corn. There is often a negative return on investment for commercial N fertilizer applications to first year corn fields following alfalfa, or fields receiving at least 10,000 gallons of liquid dairy manure, 25 tons of beef manure, or 3 tons of solid poultry manure. In liquid manure systems, sampling manure for less than $35/sample is a small investment to confirm adequate N is being provided for crop growth.
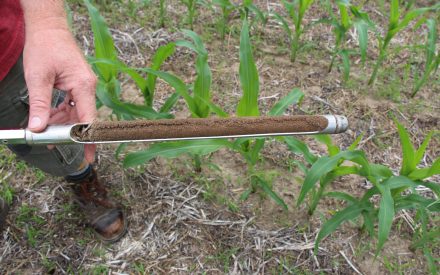
3. Assess Soil N Credits
For fields without coarse textured soils (sands and loamy sands), N soil tests can evaluate soil nitrogen levels during the growing season. Be aware that the estimated wait time for lab results from these tests are routinely two weeks. The Pre-Sidedress Nitrate Test (PSNT) is a UW recognized soil N test collected from a sampling depth of 12 inches when corn plants are between 6 and 12 inches tall. For around $13 per sample, you will receive an analysis of current soil nitrate levels along with an expected N credit for the current growing season. Haney soil tests can also be taken but be aware that results are not calibrated with UW corn N rate guidelines.
4. Measure Field Nitrogen Use Efficiency
In addition to evaluating N decisions for 2026, this year is an excellent time for farmers to evaluate the long-term financial and environmental impacts of their N management decisions. A frequently stated “rule of thumb” for corn nitrogen applications is that one pound of nitrogen is needed for every bushel of corn yield (also referred to as the Nitrogen Use Efficiency or NUE). However, Wisconsin Discovery Farms research has shown that the NUE of individual fields can vary significantly from this general principle. An easy assessment for determining field NUE is to conduct a zero-N test strip alongside typical N applications. Yields and N inputs are collected from both field areas and used in calculations to determine how much N the soil supplies for crop growth, how additional N applications improved yields, and what percentage of applied nitrogen was taken up by the crop. NUE information, combined with the previously identified N management decisions, can establish field-specific corn N application rates that provide a high potential rate of economic return while reducing N losses that negatively impact water quality.
Takeaway
Given current economic circumstances, 2026 appears to be another challenging year to grow corn. Farmers still have time to assess the need for purchasing additional nitrogen for their corn cropping systems this year. Identifying cost-effective application rates, accounting for on-farm nitrogen sources, assessing soil N credits, and measuring nitrogen use efficiency can help improve corn enterprise profitability this year and for many years to come.
Published: May 5, 2026
Reviewed by: Jerry Clark and Matt Bolen