DOI Citation: http://digital.library.wisc.edu/1793/96363
Note: Terms in bold are defined in the glossary at the end of the article.
Introduction
Minimizing nitrogen (N) loss to groundwater is important for human health, the environment, and long-term farm profitability. Quantifying nitrate leaching – a primary pathway of nitrogen loss from agricultural fields – can help you understand the influence of different management practices on water quality, and identify options for reducing nitrate leaching.
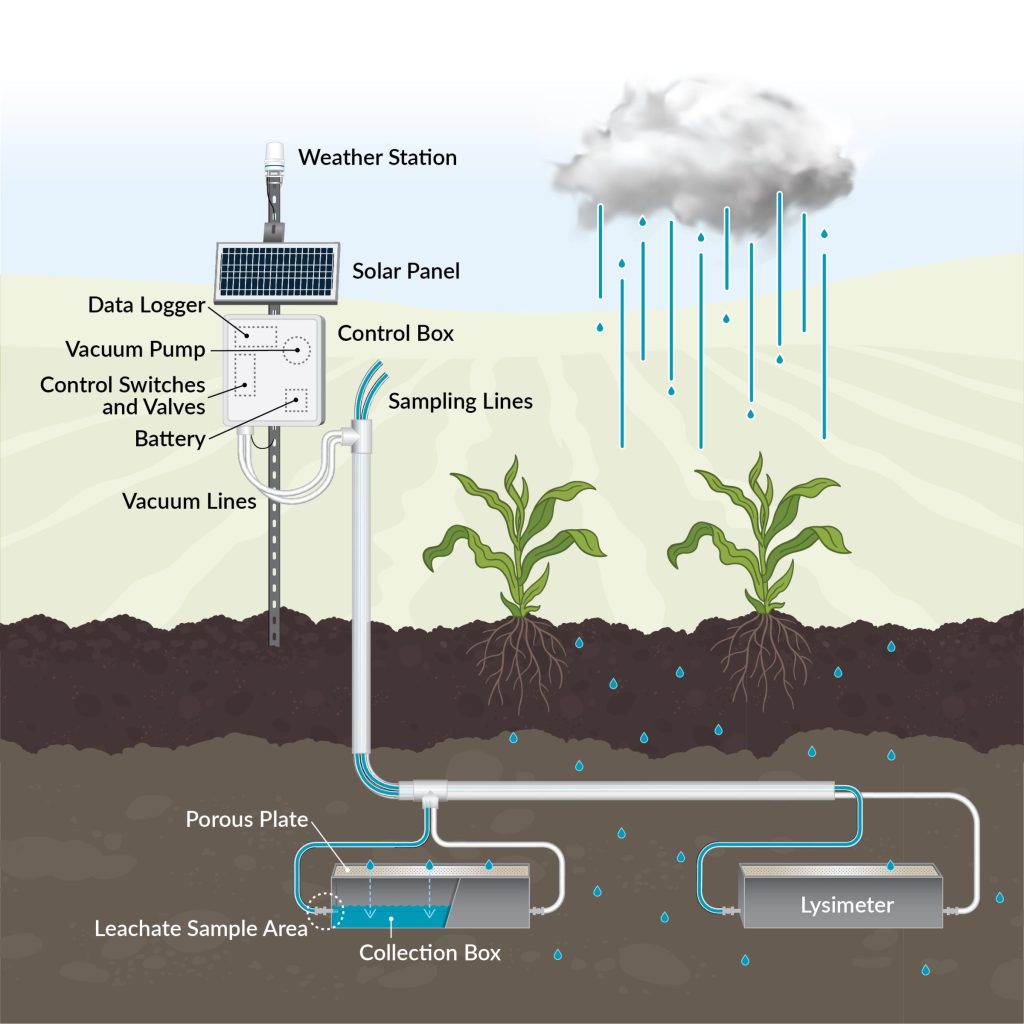
Here we outline several common ways to quantify nitrate leaching (Figure 1). We focus on the nitrate form of nitrogen (and not nitrite or ammonium) because nitrate is typically present in higher concentrations. Most of the methods described can be used to measure other forms of N leaching as well. Each method has different benefits and tradeoffs in terms of data accuracy, equipment needed, and time and labor requirements, which are discussed below.
When choosing a method, start with the specific question you want to answer and work backwards to determine the most appropriate and feasible approach. Table 2 at the end of this article highlights some common research questions around nitrate leaching and agricultural practices.
No matter which method you use, it’s important to keep detailed records of the amount of N applied (e.g., in fertilizer, manure, or through irrigation) and the crop yields. These values will help put your results in context.
Estimating Potential Nitrate Leaching
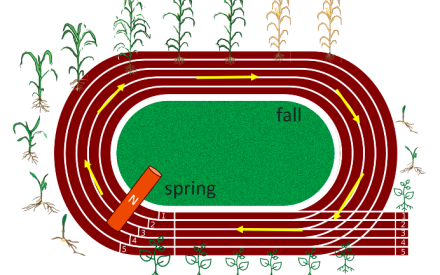
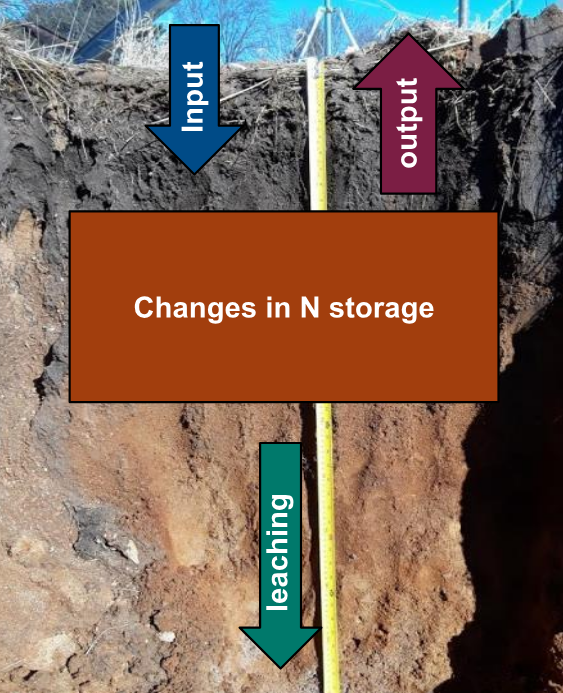
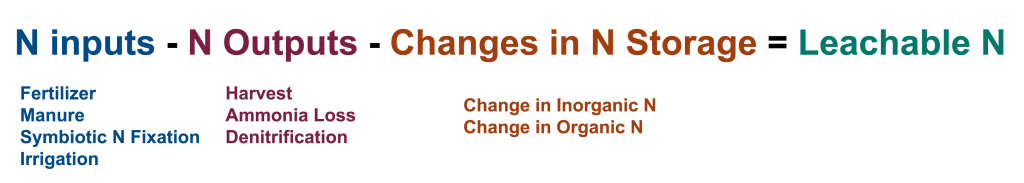
A mass-balance based nitrogen budget can help you estimate nitrogen losses without taking any additional measurements. A nitrogen budget considers nitrogen that goes into the field (inputs like synthetic fertilizer, manure, and biological fixation) and nitrogen that is removed from the field (outputs like crop removal) or stored in the soil to estimate the amount of nitrogen vulnerable to leaching during and after the growing season (Figure 2). By comparing nitrogen budgets under different management scenarios, you can identify opportunities to reduce nitrate leaching through management changes. For a more detailed guide on how to build a field-based nitrogen budget, read the article, “Manage nitrogen as a budget to reduce groundwater contamination,” or jump to the Nitrate Leaching Calculator Tool, which uses the nitrogen budget approach.
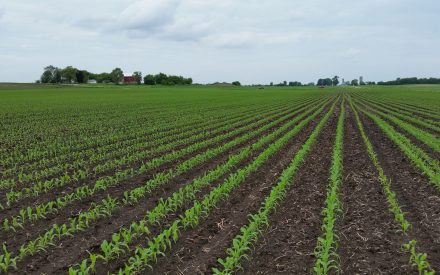
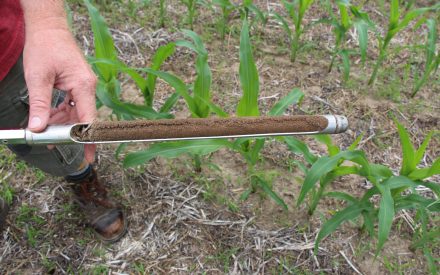
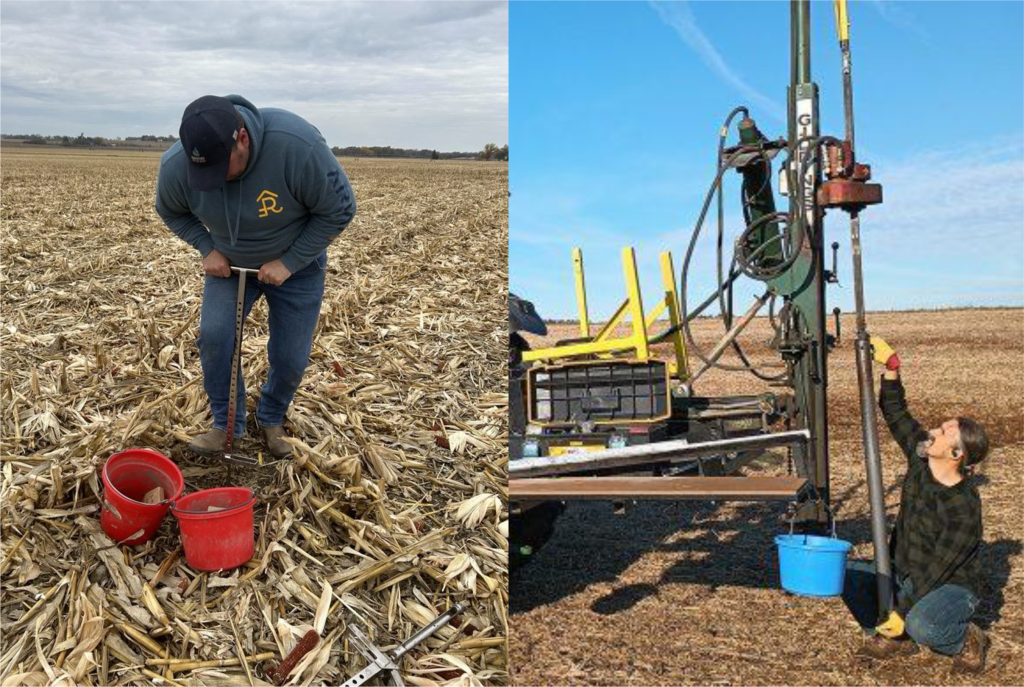
Soil profile nitrate sampling after crop harvest is a simple way to assess nitrate leaching potential during the shoulder seasons. The assumption of this method is that nitrate remaining in the soil after crop harvest is vulnerable to leaching, especially if plants are not actively growing, like a cover crop. This method is most effective during years of normal to dry precipitation; during wet years, most residual nitrate may be leached during or near the end of the growing season, prior to the collection of post-harvest soil samples. Routine soil fertility samples (0-1 ft) can be used to measure residual nitrate in topsoil, but for completeness it is better to sample to a depth of 2 or even 3 feet, as the subsoil may also contain substantial soil nitrate (Figure 3). Residual nitrate is calculated as the product of the soil nitrate concentration and bulk density for each depth increment (e.g., 0-1 ft, 1-2 ft, 2-3 ft), and these values are summed and expressed on an area basis (e.g., lb NO3-N/ac) (Table 1). Nitrate (NO3–) is often expressed in terms of nitrate-N, the nitrogen component of the nitrate ion. Importantly, although soil nitrate concentration data are often expressed in commercial lab reports as “ppm”, this refers to the mass of nitrate-N per dry mass of soil (mg N/kg soil), rather than the concentration of nitrate-N in water as discussed below (i.e., mg N/L), which is also commonly referred to as ppm. Soil bulk density can be estimated through resources such as the NRCS Web Soil Survey or from equations that use measurements of other soil properties (texture and organic matter)1, or it can be measured directly if appropriate equipment is available. It is important to emphasize that soil measurements represent only a “snapshot” in time, and biological processes (e.g., nitrogen mineralization, immobilization, denitrification) occurring after sampling influence the actual amount of nitrate vulnerable to leaching2.
For each depth increment in the profile, the equation is:
Residual Nitrate-N (lb/ac) = depth (in) * 2.54 (cm/in) * soil nitrate concentration (mg/kg) * bulk density (g/cm3) * (0.1) * 0.89 (lb/ac / kg/ha)
In this equation, 2.54 is the conversion between inches and cm, 0.1 converts the product of the previous metric terms in the equation to kg/ha, and 0.89 is the conversion from kg/ha to lb/ac. Table 1 shows example data and the resulting calculation. Residual nitrate values from each depth increment (last column) are summed to estimate total nitrate leaching potential for 0-3 feet (e.g., 145 lb NO3-N/ac).
| Depth increment | Depth of sample | Texture | Soil nitrate concentration (mg NO3-N/kg) | Bulk density (g/cm3) | Residual nitrate (lb NO3-N/ac) |
|---|---|---|---|---|---|
| 0-1 ft | 12 | Silt Loam | 10 | 1.42 | 39 |
| 1-2 ft | 12 | Silt Loam | 10 | 1.50 | 41 |
| 2-3 ft | 12 | Loam | 15 | 1.60 | 65 |
| Total, 0-3 ft | 36 | – | – | – | 145 |
Measuring Nitrate Leaching With Lysimeters And Other Methods
Broadly speaking, lysimeters are instruments that collect agricultural drainage (water, and any chemicals carried by that water, including nitrate), as it moves through the soil profile (see Box 1 for more on the definition of “lysimeter”). Lysimeters are most useful when installed below the deepest crop root in a rotation (typically 2-6 feet).
Lysimeters measure soil water drainage for different purposes, like estimating crop water use or chemical leaching. If leaching is the main goal, the lysimeter must capture drainage water for chemical analysis and has to be emptied periodically with a pump. When emptied, the volume of agricultural drainage pumped from the lysimeter is recorded. This can be converted into a water flux, which is the amount of water moving through the lysimeter footprint area during a given time period (e.g., 1 inch of water per week). A small sample, typically 100 mL (3 oz) or less, of the drainage water is collected and measured for nitrate concentration in a laboratory.
The Soil Science Society of America defines a lysimeter as:
“(a) A device for measuring percolation and leaching losses from soil under controlled conditions. (b) A device for measuring gains (irrigation, precipitation, and condensation) and losses (evapotranspiration) from soil.3″
In practice, the term lysimeter has also been used to describe other methods that sample soil water or provide an estimate of nitrate leaching, but do not strictly meet this lysimeter definition, because they do not measure or collect drainage water. For example, suction cup samplers can be used to measure the nitrate concentration of soil water but they cannot measure drainage water, which is necessary to quantify nitrate leaching amounts. The best methods for measuring nitrate leaching include assessment of drainage water amount as well as nitrate concentration, a distinction that is important for practitioners to remember when choosing measurement approaches and evaluating results of previous studies.
Box 1: What is a lysimeter, and why should I care?
The water flux is multiplied by the nitrate concentration to determine the nitrate load or nitrate yield exported to the groundwater during a period of time (see glossary for units). Because nitrate leaching can be highly variable within a particular field, multiple lysimeters should be installed and sampled to calculate average values.
A large portion of nitrate leaching often occurs during the “shoulder” seasons (early spring and fall), therefore it is important to frequently measure and empty water accumulated in the lysimeter storage reservoirs during these periods for accurate drainage capture and estimation. To check if a lysimeter is operating correctly, you can compare drainage from the lysimeter to drainage estimated from the remainder of the water balance (e.g., drainage = precipitation + irrigation – evapotranspiration + runoff +/- changes in soil moisture). If lysimeter drainage is significantly higher than estimated drainage, the lysimeter may be over-estimating drainage; if lysimeter drainage is lower, the lysimeter may be under-estimating drainage. The design of the lysimeter affects their drainage collection performance.
How Lysimeters Work
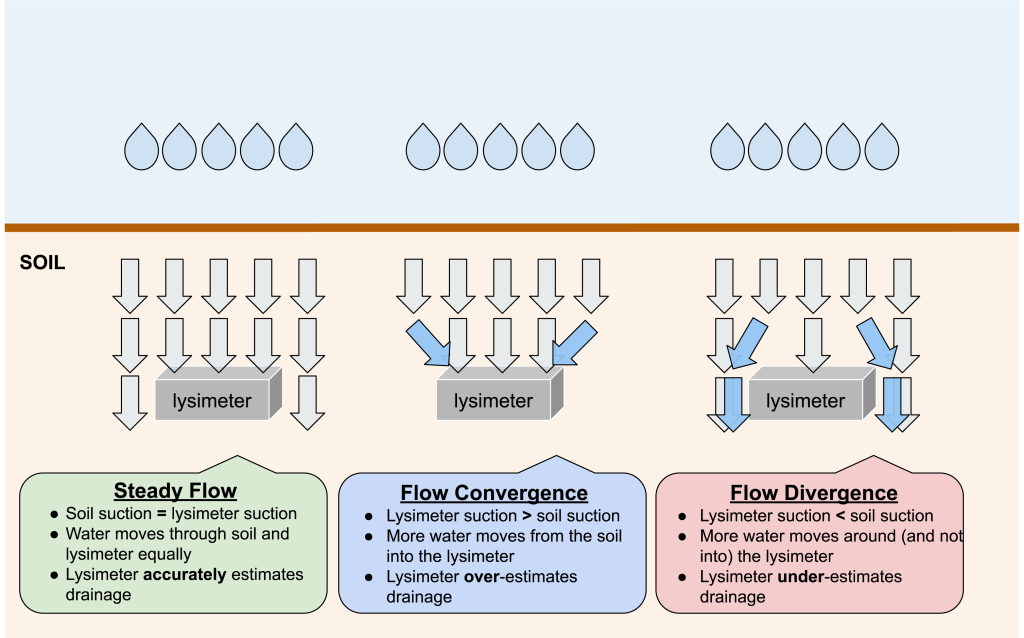
Lysimeters function best when they are able to mimic the soil matric potential, a measure of how tightly water is held (also referred to as “tension” or “suction”), of the surrounding soil. If the lysimeter suction is stronger than the surrounding soil, lysimeters may pull in more pore water from the adjacent soil (“convergent flow”), overestimating the true drainage (Figure 4). If the lysimeter suction is weaker than the surrounding soil, soil water may flow around the lysimeter (“divergent flow”), underestimating drainage4. A lysimeter may experience convergent, divergent, and steady water flow depending on how the soil matric potential changes over time. There is a spectrum of simple to complex lysimeters based on their ability to accurately mimic the suction of the surrounding soil as it changes in response to precipitation, irrigation, and plant water use. This in turn influences the quality of the data collected and the types of questions that each lysimeter type can address. Increasing the number of lysimeters (replication) can improve estimates by capturing more variability and increasing measurement confidence. For capturing canopy-scale drainage measurements (measurements that represent the crop canopy and spaces between rows), larger collection surface areas (on the top of the lysimeter where drainage enters) are required.
Types of Lysimeters
Among the most complex lysimeters for capturing agricultural drainage are equilibrium tension lysimeters (ETLs), which are often similar in size to the canopy of an individual crop plant (e.g., > 2 ft2). ETL collection boxes are typically made of stainless steel and are installed below the crop root zone, ideally beneath an undisturbed soil profile (Figure 5). ETLs have sensors that measure soil suction at the depth where drainage is captured. Suction is applied to the ETL through an electronically controlled vacuum pump to mimic surrounding soil suction. Thus, ETLs can capture realistic agricultural drainage volumes and provide some of the most accurate estimates of nitrate leaching. ETLs can remain installed and sampled for multiple years with minimal interference on field operations, allowing for data collection across crop rotations, varying weather events, and seasonal changes. Nevertheless, ETLs are not commercially available and difficult to install, often requiring excavators and other heavy equipment, which can be costly and disruptive to the field site. Construction and maintenance of these lysimeters is expensive and requires advanced technical expertise. When soil suction conditions change rapidly (e.g., storms, snowmelts, heatwaves) lysimeters may not align with the surrounding soil suction, causing errors. Finally, ETLs may be completely filled with water during large drainage events (e.g., snowmelt) depending on the size of their collection reservoir5, 6. Overall, ETLs are a “gold standard” for measuring nitrate leaching, but their use is typically limited to long-term applications and research partnerships.
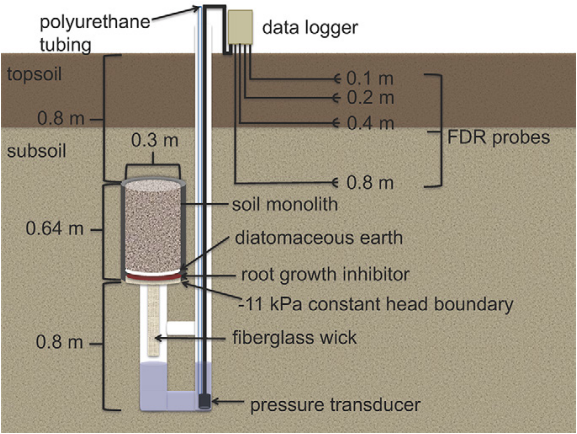
Fixed tension lysimeters (e.g., passive capillary wick lysimeters) maintain a constant suction through a wick (often fiberglass), typically designed to mimic the soil suction at field capacity (the water content after water has drained from larger soil pores). These lysimeters are most reliable in sandy soils where the range of soil suction the soil experiences is narrow and closely matches the wick. Even in sandy soils, however, these lysimeters can over- or under-estimate agricultural drainage when the surrounding soil suction does not match the constant suction at the drainage capture boundary. Maintaining undisturbed soil above the wick helps minimize divergent or convergent flow around the lysimeter, improving drainage estimates7. Because of the constant suction applied, fixed tension lysimeters are less accurate than ETLs in measuring drainage, but also tend to be much less expensive and easier to maintain for the same reason. As a result, they can be a “middle ground” that decreases cost without significantly sacrificing measurement accuracy, particularly in sandy soils.
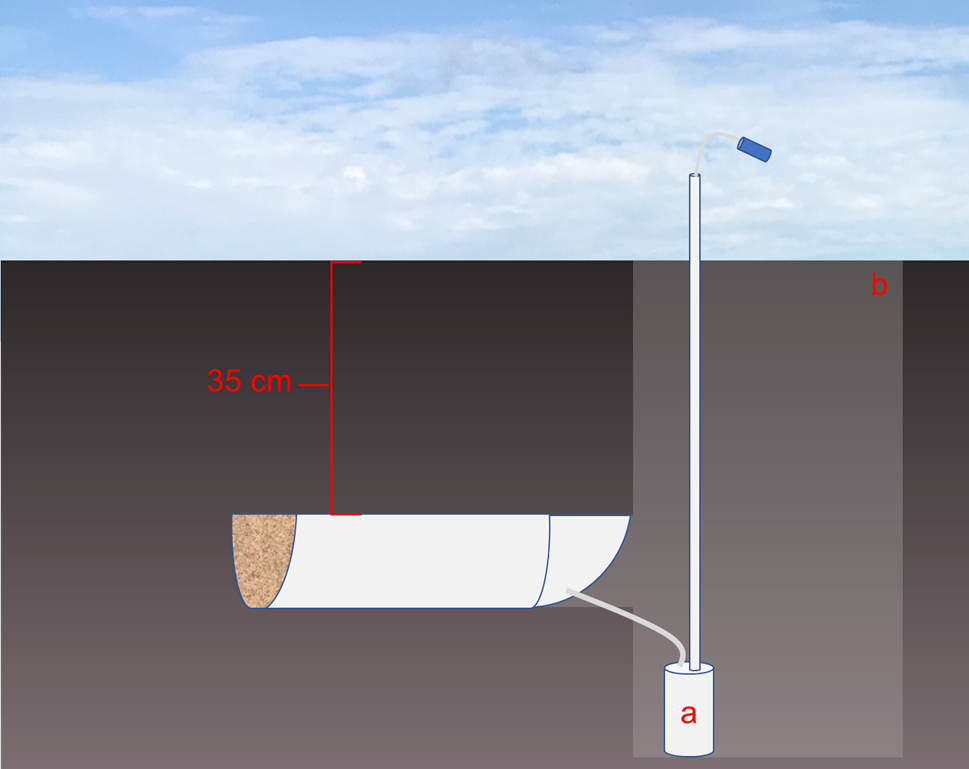
Zero-tension lysimeters are installed under soil without any mechanisms to mimic the naturally occurring soil suction. They rely solely on a saturated soil zone above the lysimeter and gravitational flow to move soil water into the lysimeter. Zero-tension lysimeters can be fabricated at low cost, but because of the high likelihood of divergent flow (due to no suction applied), they cannot reliably measure the amount of agricultural drainage, preventing the direct calculation of nitrate yield5. Nevertheless, zero-tension lysimeters can provide useful information about patterns in nitrate concentrations (or other chemical constituents) of soil drainage, enabling evaluation of management practices or addressing other questions where “relative” rather than “absolute” results might suffice8. Zero-tension lysimeters have been fabricated out of a wide range of materials including half-sections of pipes (Figure 7), trays, boxes, and barrels, depending on the particular application.
One approach to eliminate divergent flow in a zero-tension lysimeter design is to enclose a volume of soil on the sides and bottom (e.g., within a steel box or barrel), forcing drainage to leave through a single outlet9. This design may be attractive for long-term research applications but is less feasible for use on commercial farms given the difficulty of conducting typical field operations with these lysimeters in place.
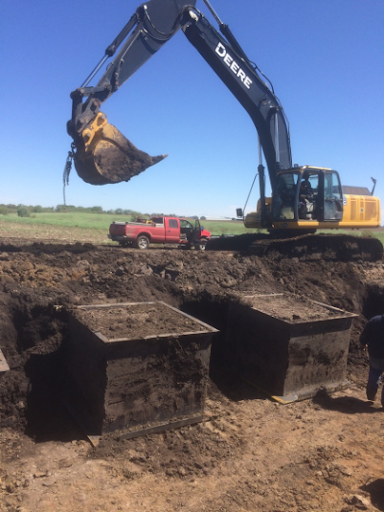
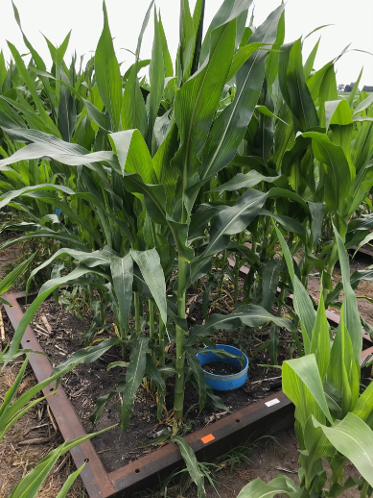
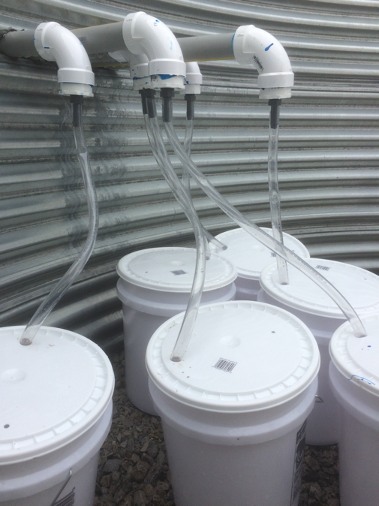
Figure 8: Illustration of an extreme example of a zero-tension lysimeter installation, where intact soil profiles were enclosed on sides and bottom in steel boxes with a single drain, which allowed complete measurement of drainage volume and chemical composition. Photo credits: Steven Hall (left, center); Loper et al., 20249 (right).
Other Methods
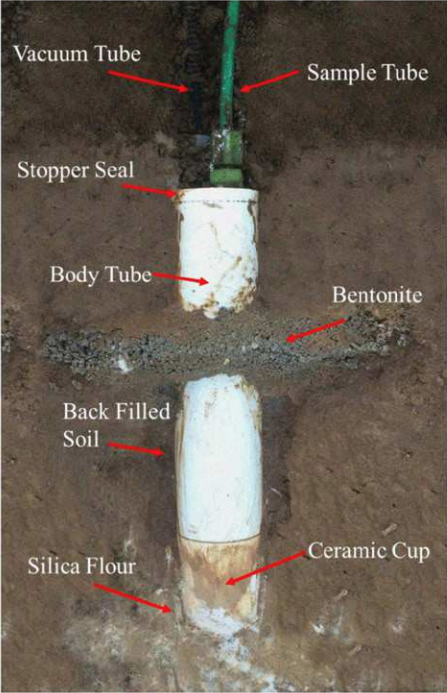
Suction cup samplers consist of a sampling tube connected to a porous cap (typical diameter < 1”) which is buried in or beneath the root zone. Suction is applied to the sampler and an attached collection bottle, which accumulates water from soil through the suction cup pores until the collection bottle fills, or until suction applied to the sampler matches the surrounding soil. Measurements of nitrate concentration in suction cup samplers are often highly variable over space, requiring many replicates to understand trends. Importantly, suction cups may not effectively sample water from the larger soil pores (“macropores”) that are responsible for much of the drainage and nitrate leaching. Also, suction cups do not provide any information about the amount of drainage (drainage volume) because they operate under a gradually decreasing vacuum instead of continuously collecting drainage water like, for example, ETLs. To estimate nitrate leaching using suction cup lysimeters, measured nitrate concentrations must be multiplied by approximate drainage volumes, which can potentially be estimated using hydrological models10. Similar to zero-tension lysimeters, suction cup samplers can be useful for characterizing relative impacts of different management practices on soil nitrate (e.g., cover crops vs. no cover crops), but by themselves they do not provide total estimates of nitrate leaching from a field11.
Resin accumulators have often been termed “resin lysimeters” in the scientific literature but do not meet the strictest definition of a lysimeter (Box 1) given that they do not measure drainage volume. They consist of a layer of ion-exchange resin installed between porous mesh within a plastic pipe (typical diameter and length of ~2 inches) capped with sand on both ends. After digging a hole, the small pipe is placed vertically into a pocket carved beneath a profile of undisturbed soil, typically at a depth of two or three feet, and the excavated soil adjacent to the accumulator is replaced. Location is recorded with high-precision GPS to enable accumulator retrieval, often after one growing season or one calendar year. The nitrate in drainage flowing through the pipe is trapped by the resin. After retrieval, the resin is extracted in a salt solution to release the accumulated nitrate for measurement. Cumulative nitrate leaching during the period of deployment is then expressed as mass per unit area of the pipe (nitrate yield). This method is relatively inexpensive and does not interfere with farm operations. However, resin accumulator data should generally be used only to compare management treatments within the same field, and not necessarily interpreted as an absolute value12. Because the resin accumulator alters the physical properties of the soil and could promote flow convergence or divergence, measured values may overestimate or underestimate actual nitrate leaching from a given site13. Answering questions such as how nitrate losses vary under different management practices, high replications within each treatment can help capture the potential variability. Nevertheless, resin accumulators are gaining popularity for use in on-farm research across Wisconsin and elsewhere in the Midwest, because they can help address real-world questions posed by producers at a relatively low cost when compared with many of the other methods described above.
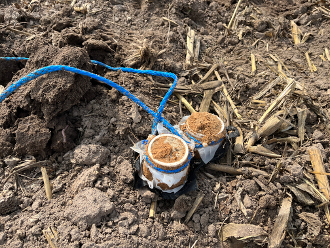
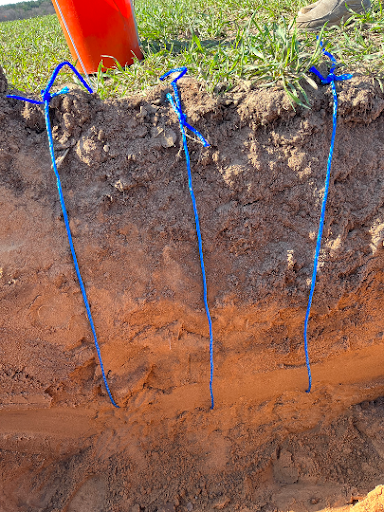
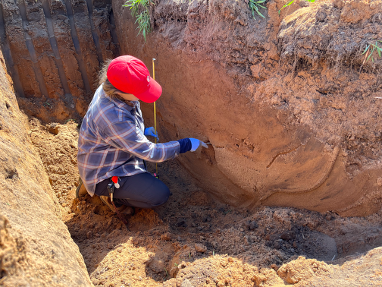
Figure 10: Illustration of resin accumulators prior to installation (left), during installation in a soil pit (middle), and after installation, before the pit is refilled (right). Geolocating the lysimeters is highly encouraged to facilitate retrieval. Photo credit: Lindsey Rushford
Lastly, if you have tile drainage on your farm, measuring nitrate concentrations at tile drainage outlets can be informative. To calculate the total nitrate load, the nitrate concentration would need to be multiplied by the volume of drainage flowing through the tile. On-farm research conducted by Wisconsin Discovery Farms found that taking bi-weekly grab water samples for nitrate concentration over the entire year accurately approximates the average annual nitrate concentration of outlet water (compared to more cost prohibitive 24/7 automated flow samplers). While this approach does not quantify nitrate leaching to groundwater (water from tile drainage outlets typically enters surface waters), it is still a cost-effective way to assess the effect of in-field nitrogen management practices on water quality. Read more about this approach in the article, “A cost-effective approach for on-farm tile monitoring”.
Conclusion
There’s a lot to consider when quantifying nitrate leaching. Table 2 can help you weigh advantages and disadvantages of different methods. Identifying the question you are asking is an important first step to finding the approach that works best for you.
Be realistic about the resources (time, labor, funds) you can invest in a project. For example, while equilibrium tension lysimeters (ETLs) provide excellent nitrate leaching data, they require a lot of technical knowledge, are costly, and not commercially available. Conducting a simple N budget may help answer your question at much lower cost. Measurement timing is another important consideration, as nitrate leaching often occurs in the shoulder seasons, especially in fields without well-established cover crops or perennial plants. If measurements only happen during the growing season, they do not give the full picture of nitrate leaching dynamics in your system.
If you have questions about nitrate leaching or lysimeters, want help deciding on an approach, designing an experiment, or making sense of the data you’ve collected, please contact the Agriculture Water Program for experts who can help!
Glossary
Bulk Density – Mass of soil per unit volume. Example: 1.4 g / cm3
Nitrate Concentration – Mass of nitrate-N per volume of water, typically expressed as parts per million, or ppm = mg/L. Example: 10 ppm or mg/L of NO3-N
For soils, nitrate concentration typically refers to the mass of nitrate-N per mass of dry soil, and can also be expressed as ppm, but with units of mass per mass (e.g., mg/kg).
Nitrate Leaching – A process where soil nitrate is lost below a specific soil depth (often the crop root zone) in water draining through the soil.
Nitrate (or Nitrogen) Leaching Potential – The amount of “extra” soil nitrogen that is potentially vulnerable to loss through leaching, often estimated through a simple nitrogen balance or residual soil nitrate measurements (as described below).
Nitrate Load – The mass or amount of nitrate-N leached over a specific timescale. Example: 20 lb N / yr
Nitrate Yield – The mass of nitrate-N leached over a specific area and timescale. In practice, the words nitrate “load” and “yield” are sometimes used interchangeably, but “yield” is the better choice when leaching is expressed on an area basis. Example: 20 lb N / ac / yr
Residual Soil Nitrate – The nitrate remaining in the root zone (0-2 or 0-3 ft), often measured after crop harvest. Example: 50 lb N / ac / yr
Soil Matric Potential, Tension – A measure of how “tightly” water is held in soil pores and available for plant uptake or drainage, measured in units of pressure. Examples: -30 kPa or -4.3 psi
Soil Suction – The “negative” of soil matric potential or tension. Examples: 30 kPa or 4.3 psi
Water Flux – The amount of water moving through a certain depth of soil, typically defined as a depth per unit time. Example: 12 in / yr
Table 2: Approaches for quantifying nitrate leaching and interpretation.
| Approach | What is quantified? | Use | Limitations | *What questions can this answer? |
|---|---|---|---|---|
| N budget | Estimates nitrogen surplus that is vulnerable to leaching | Estimate N surplus | Cannot measure nitrate leaching directly Certain metrics of an N budget can be highly uncertain (i.e. mineralization) | What is the nitrogen surplus? Larger N surpluses indicate greater risk of nitrate leaching |
| Soil profile nitrate sampling | “Snapshot” in time of nitrate in the soil | Estimate residual nitrate | Cannot measure nitrate leaching directly A “snapshot” in time Actual N leached will depend on additional factors (soil processes, weather) | How much residual nitrate is potentially available for leaching during the shoulder seasons? |
| Suction cup samplers | “Snapshot” in time of soil water nitrate concentration in micropores | Comparison between treatments | High spatial and temporal variability Cannot measure nitrate leaching directly; must rely on drainage estimates from modeling | How does soil water nitrate concentration vary among treatments and over time? |
| Resin accumulators | Total nitrate yield during deployment | Comparison between treatments | High spatial variability Can only determine total nitrate leaching during deployment period May overestimate or underestimate “true” leaching values | How does total nitrate leaching during time of deployment vary among treatments? |
| Zero tension lysimeters | Nitrate load over time (inaccurate drainage measurements) | Comparison between treatments; generally not recommended | Drainage estimates too inaccurate to analyze | How does nitrate concentration in drainage vary among treatments or over time? |
| Fixed tension lysimeters | Nitrate load over time (more accurate drainage measurements) | Comparison between treatments Absolute leaching value | Drainage estimates limited by device matching soil tension (works best in sandy soils where soil tension at drainage varies less) | How much nitrate leached across treatments or over time? |
| Equilibrium tension lysimeters | Nitrate load over time (the most accurate drainage estimates) | Comparison between treatments Absolute leaching value | High initial cost and labor intensive, often requiring university partnerships | How much nitrate leached across treatments or over time? |
* When treatments are mentioned, examples include cropping system comparisons, cover crop types, nitrogen fertilizer rate, soil types, etc.
References
- Rawls, Walter J. 1983. “Estimating Soil Bulk Density from Particle Size Analysis and Organic Matter Content.” Soil Science 135 (2): 123. https://doi.org/10.1097/00010694-198302000-00007.
- Wey, H., Hunkeler, D., Bischoff, WA. et al. Field-scale monitoring of nitrate leaching in agriculture: assessment of three methods. Environ Monit Assess 194, 4 (2022). https://doi.org/10.1007/s10661-021-09605-x
- Soil Science Society of America. n.d. “Glossary of Soil Science Terms.” Accessed October 14, 2025. https://www.soils.org/publications/soils-glossary/browse/l?q=publications/soils-glossary/browse/l/.
- Nocco, Mallika A., George J. Kraft, Steven P. Loheide II, and Christopher J. Kucharik. 2018. “Drivers of Potential Recharge from Irrigated Agroecosystems in the Wisconsin Central Sands.” Vadose Zone Journal 17 (1): 22. https://doi.org/10.2136/vzj2017.01.0008.
- Brye, K. R., Norman, J. M., Bundy, L. G., & Gower, S. T. (1999). An equilibrium tension lysimeter for measuring drainage through soil. Soil Science Society of America Journal, 63, 536-543.
- Masarik, K. C., Norman, J. M., Byre, K. R., & Baker, J. M. (2004). Improvements to measuring water flux in the vadose zone. Journal of Environmental Quality, 33, 1152-1158.
- Gee, G. W., B. D. Newman, S. R. Green, R. Meissner, H. Rupp, Z. F. Zhang, J. M. Keller, W. J. Waugh, M. Van Der Velde, and J. Salazar. 2009. “Passive Wick Fluxmeters: Design Considerations and Field Applications.” Water Resources Research 45 (4): 2008WR007088. https://doi.org/10.1029/2008WR007088.
- Lawrence N, Hall SJ. 2024. Mechanisms underlying episodic nitrogen and phosphorus leaching from poorly drained agricultural soils. Journal of Environmental Quality 53: 643-656.
- Loper, Holly, Carlos Tenesaca, Carl Pederson, et al. 2024. “Insights on Agricultural Nitrate Leaching from Soil Block Mesocosms.” Journal of Environmental Quality 53 (4): 508–20. https://doi.org/10.1002/jeq2.20586.
- Hall, S. J., M. A. Baker, S. B. Jones, J. Stark, and D. R. Bowling. 2016. Contrasting soil nitrogen dynamics across a montane meadow and urban lawn in a semi-arid watershed. Urban Ecosystems 19:1083-1101
- Singh, Gurbir, Gurpreet Kaur, Karl Williard, Jon Schoonover, and Jasjit Kang. 2018. “Monitoring of Water and Solute Transport in the Vadose Zone: A Review.” Vadose Zone Journal 17 (1): 1–23. https://doi.org/10.2136/vzj2016.07.0058.
- Hall, S. J., Tenesaca, C. G., Lawrence, N. C., Green, D. I. S., Helmers, M. J., Crumpton, W. G., Heaton, E. A., & VanLoocke, A. (2023). Poorly drained depressions can be hotspots of nutrient leaching from agricultural soils. Journal of Environmental Quality, 52(3), 678–690. https://doi.org/10.1002/jeq2.20461
- R. B. Susfalk & D. W. Johnson (2002) Ion exchange resin based soil solution lysimeters and snowmelt solution collectors, Communications in Soil Science and Plant Analysis, 33:7-8, 1261-1275, DOI: 10.1081/CSS-12000388
Reviewed by Francisco Arriaga, Matt Ruark, and Kevin Masarik.
December 2, 2025