This article was originally published in the Wisconsin State Farmer.
In 2018, Discovery Farms, part of the University of Wisconsin–Madison Division of Extension, in partnership with the Juneau County Land and Water Resources Department and the Agricultural Producers of Lake Redstone, began a multi-year water quality monitoring study in the Lake Redstone watershed near the border of Juneau and Sauk Counties. The goal of the partnership was to evaluate cropping and management systems that minimize soil and nutrient losses in surface runoff, which are critical needs in the highly sloped land commonly farmed in this region.
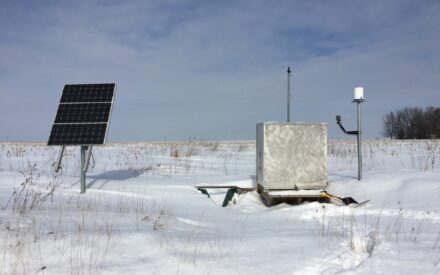
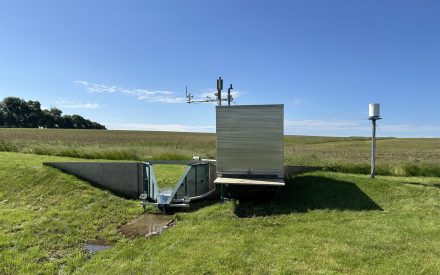
The Basic Set-up
Two surface runoff monitoring sites were installed and started collecting runoff data in fall 2018. The two basins were in two different fields, but part of the same beef farm, and were managed with no or reduced tillage and cover crops. Manure is applied on this farm as part of a community manure sharing program and in accordance with best management practices. Crops produced on the two fields included corn, alfalfa/hay, grass/hay, soybeans, and a cover crop mix.
All precipitation and runoff event volumes for each year were accounted for. Runoff volume was measured and sampling was performed using USGS methods. Samples were analyzed for suspended sediment, phosphorus, and nitrogen. Agronomic data was collected for each year, including information on crops, tillage, and nutrient applications in each field.
The Measurements
Total Phosphorus (TP):
- 3.43 lb/ac (RS1)
- 1.55 lb/ac (RS2)
- Annual losses: 0.002-1.51 lb/ac (RS1)
- Annual losses: 0.01-.72 lb/ac (RS2)
- Median annual loss for all Discovery Farms sites: 1.2 lb/ac
At RS1 and RS2, the majority of TP loss occurred during frozen soil conditions. The majority of TP was lost at both sites in March, but a single runoff event in July also significantly contributed to the TP loss at site RS2, though generating much less runoff at site RS1. The majority of TP losses were in the particulate phosphorus form at both RS1 and RS2, when farmed annually, however, in some years, dissolved phosphorus was a greater fraction of total phosphorus losses than particulate.
Total Nitrogen:
- 15.8 lb/ac (RS1)
- 7.6 lb/ac (RS2)
- Annual losses: 0.03-7.44 lbs/ac (RS1)
- Annual losses: 0.16-3.74 lbs/ac (RS2)
- Median annual loss at all Discovery Farms sites: 4.25 lb/ac
- Most nitrogen losses occurred in March at both sites.
- One event in July 2019 represented a large fraction of total losses.
Manure Application Timing
Timing of nutrient applications is an important tool to reduce the risk of TP losses from fields. At site RS1, one manure application in March was followed by two runoff events, shown as orange dots in the figure below, that accounted for the majority of the annual total phosphorus loss for this site. Five other manure applications, made on non-frozen soils later in the year did not result in any large increase in phosphorus losses, as shown in Figure 1. While the annual loss at these sites was comparatively low, a single application making up a large fraction of the total losses demonstrates the risk that one manure management decision can have on soil and nutrient losses.
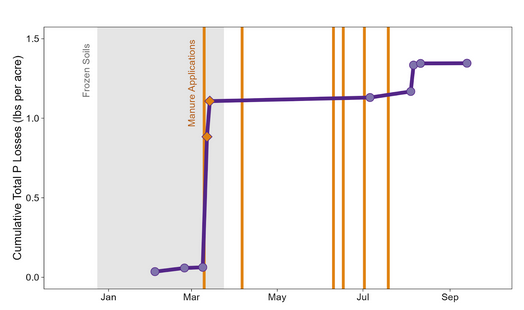
The majority of runoff occurred on frozen soils as a result of snowmelt or early spring rains at both sites. On non-frozen soils, runoff did not occur unless the soil moisture was greater than 32%. But, if soil moisture was 40% or greater, as little as 0.5” of rainfall caused runoff. Making management decisions that account for the soil conditions and the highest risk time period for runoff can reduce the risk of soil and nutrient losses. Visit the Wisconsin Runoff Risk Advisory Forecast from the Wisconsin Manure Management Advisory System to explore the current risk of runoff in your area.
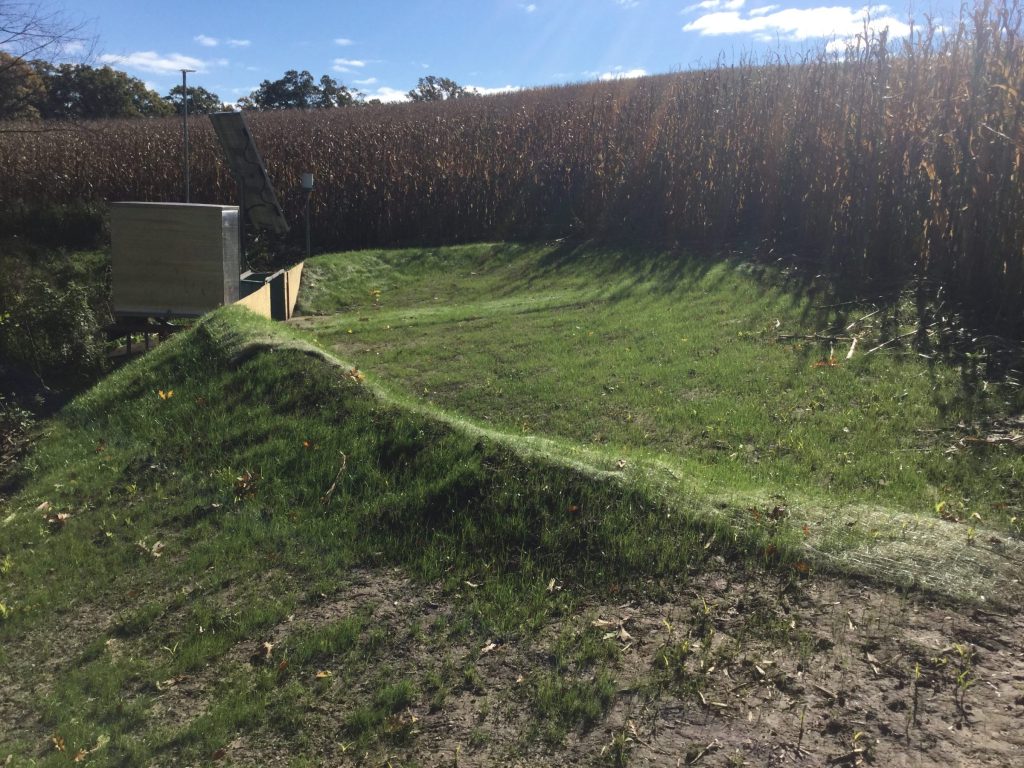
Layering Practices Reduces Losses
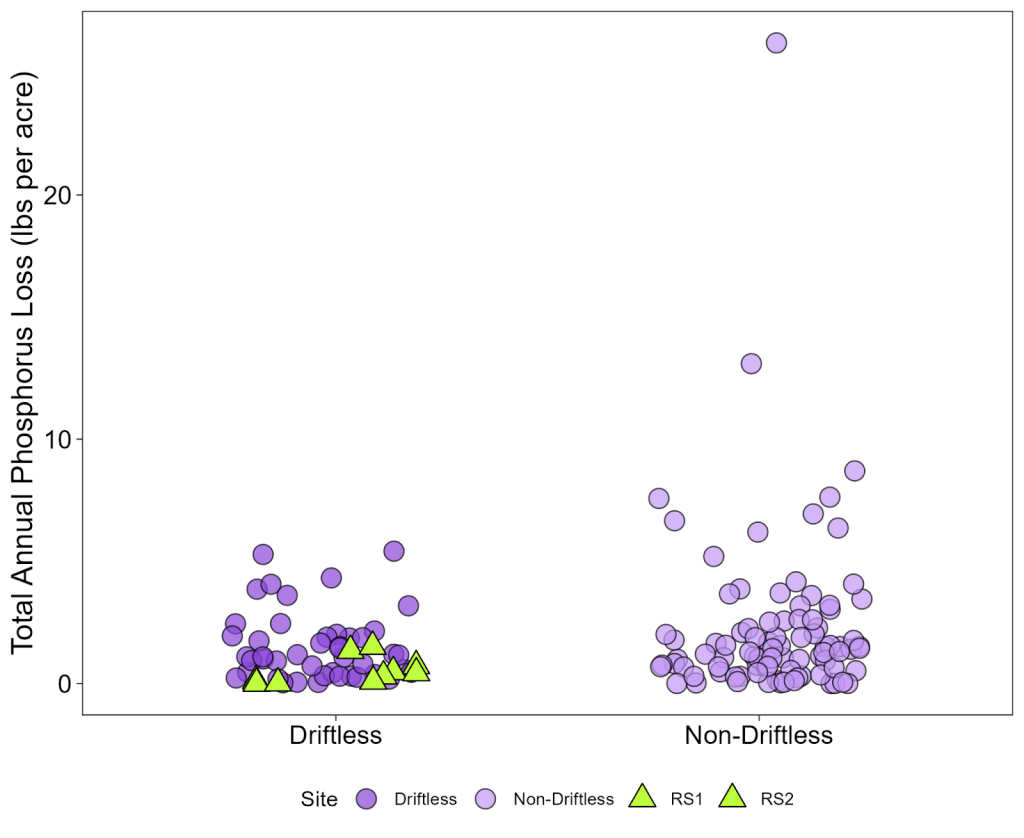
The Lake Redstone sites had consistently lower soil and nutrient losses than other Driftless Region Discovery Farms sites, despite the steep slopes, as shown in Figure 2. Phosphorus losses were highest in March, but single events, such as the runoff event in July 2019 greatly added to yearly loss amounts as well. Timing of manure application strongly influences the loss of phosphorus, but this farm also protected the sites from nutrient loss through reduced tillage, cover crops, and including perennials in their crop rotation. A good first step to layering practices like this is to identify areas of concentrated flow and potential erosion in the field. Check out the Discovery Farms Field Walkover Guide to explore how to identify areas of your fields that might need additional attention and soil protection. This walkthrough should be done annually as issues may arise or change over time.
While P losses on this Discovery Farms site were comparatively low, elevated soil test phosphorus levels are a risk for phosphorus loss through runoff. Thresholds published in the A2809 Nutrient Management Handbook clarify soil test phosphorus (STP) levels. Regular soil testing is the best method for determining if STP levels are in alignment with crop needs and for assessing P loss risk. To reduce this risk, STP can be drawn down over time by limiting phosphorus applications to bring STP levels in closer alignment with crop needs. At both the Lake Redstone sites, they were able to draw down their STP levels (Table 1) by applying no phosphorus at either site after 2019. If you are interested in assessing your STP levels on your farm, particularly if you are curious about stratification, check out the Agriculture Water Quality Program’s STP project.
| Depth | RS1 | RS2 | |
| Fall 2019 | 0-1″ 0-6″ | 48 29 | 32 25 |
| Fall 2021 | 0-1″ 0-6″ | 43 28 | 19 13 |
| Fall 2023 | 0-1″ 0-6″ | 22 17 | 22 16 |
Download Full Report
This resource is intended to be downloaded and printed locally.