This article was originally published in the Journal of Nutrient Management.
To evaluate how land use and agricultural management affect water quality, Discovery Farms — a farmer-led research collaborative within the University of Wisconsin-Madison Division of Extension — performed research on varying management systems in two western Wisconsin watersheds. Soil and nutrient runoff was measured via monitoring at field edges — the physical, complex interfaces between agricultural lands and surface waters.
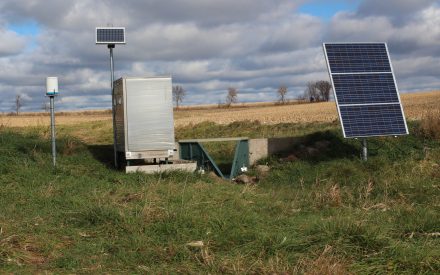
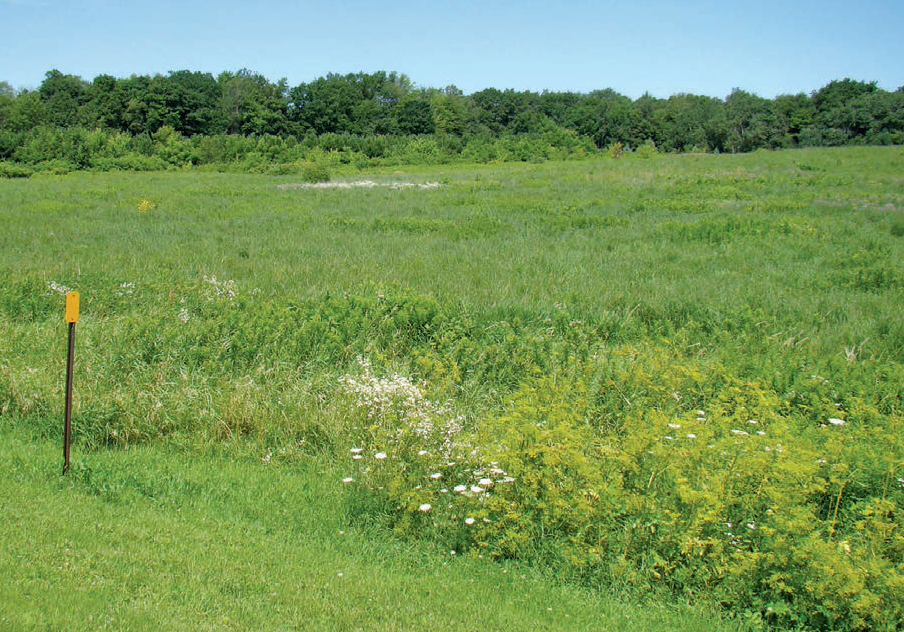
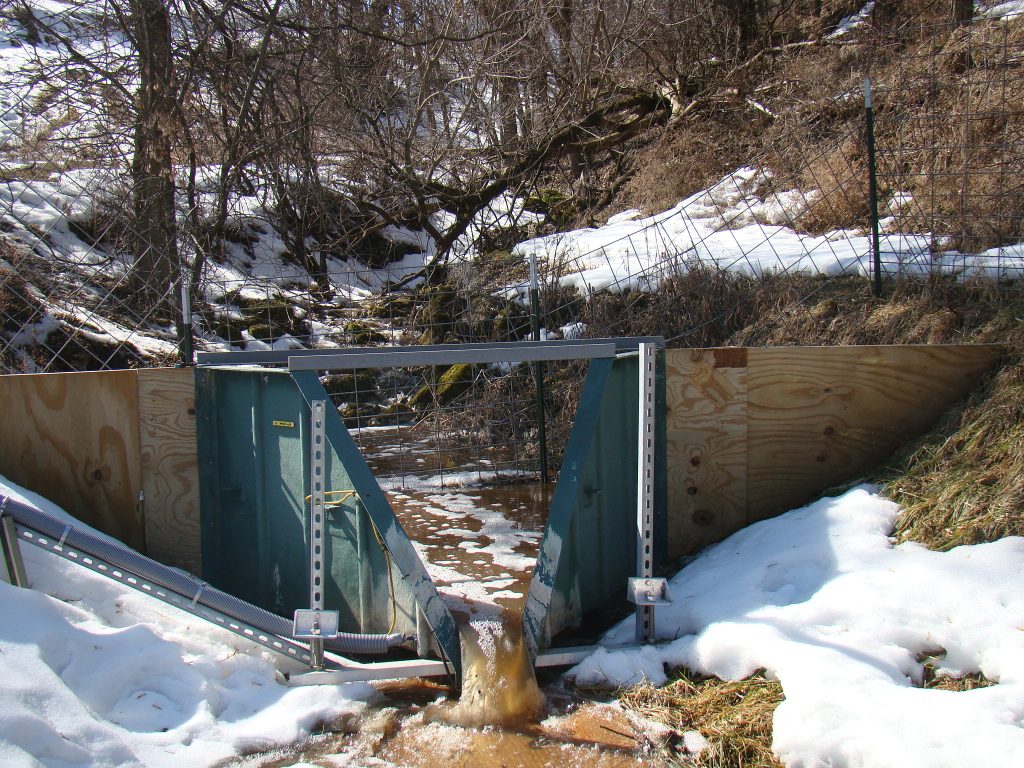
Our main goal was to better understand how agricultural land management decisions affect soil and nutrient runoff. We were also interested in how the runoff from agricultural land broadly compares to runoff from other land uses, like a wooded ravine and a Conservation Reserve Program (CRP) field, so we included edge of field monitoring stations at sites JV3 and DR3, as shown in the photos.
Two Different Areas
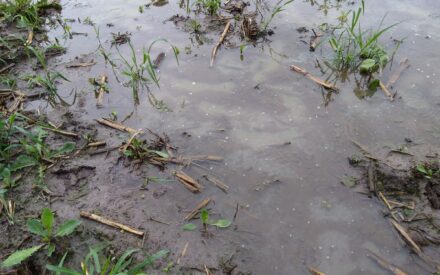
The steep, wooded ravine or gully included in our monitoring (JV3) received its runoff from a permanent pasture (JV2) in the Jersey Valley watershed in southwestern Wisconsin, which was also monitored as part of the project. Here, cattle are grazed on the fields from the end of June until September.
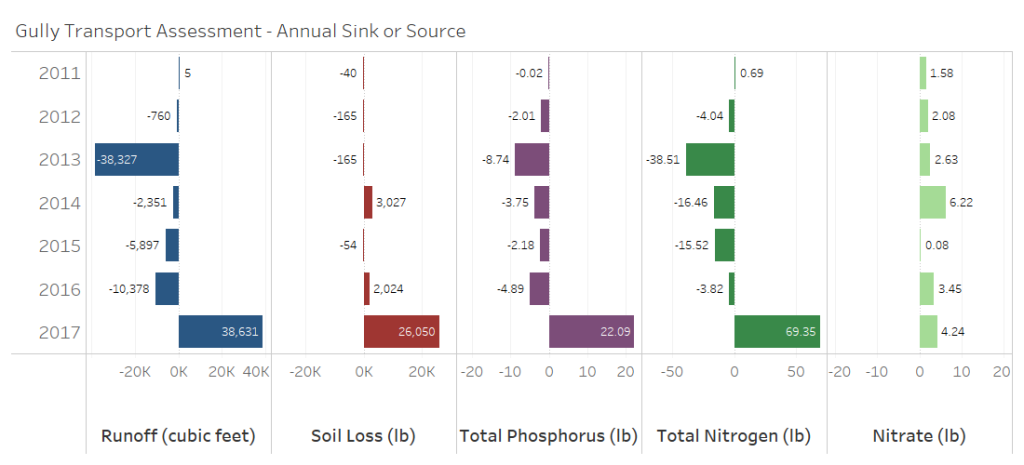
We wondered whether this part of the landscape is a source of nutrients, meaning that it produces more than it absorbs, or a sink of nutrients that absorbs more than it produces. We determined whether the gully was a source or sink by calculating the difference in the nutrients, runoff, and soil loss between the site at the top of the ravine, JV2, and the bottom of the ravine, JV3.
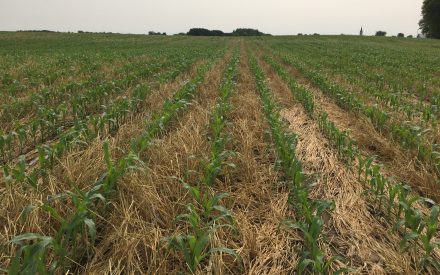
The grass field (DR3) has been enrolled in CRP for more than 10 years, and it lies in the dry run watershed in northwestern Wisconsin. The soil test phosphorus at the site was over 35 ppm.
What We Found
Some of the most interesting observations we made are shown in the figures. Keep in mind that these observations only reflect single sites. Therefore, we can’t draw scientifically significant conclusions from them.
More total phosphorus, dissolved phosphorus, total nitrogen, and runoff entered the top of the gully (Site JV2) than left the bottom during six of seven years. This particular gully area is usually a form of water quality protection for the stream below. However, during a large storm in July 2017, the gully became a source of total phosphorus and nitrogen, dissolved phosphorus, and runoff. During the July 2017 storm, 22,000 pounds of soil washed out of the gully, which equates to 75% of the soil loss measured at JV3 during the entire seven-year study period.
Wooded ravines like JV3 dot the landscape of southwest Wisconsin. They are often overlooked when surveying a farm for water quality risks or areas for improvement. By practicing reduced tillage, year-round cover, and careful manure timing, you can manage both a field or pasture, like JV2, and a wooded ravine by taking a proactive approach to reduce the nutrients, soil, and runoff that enter the ravine. This lowers the chances that the soils in the ravine will build up nutrients over time and then release them when heavy rain causes an erosion event.
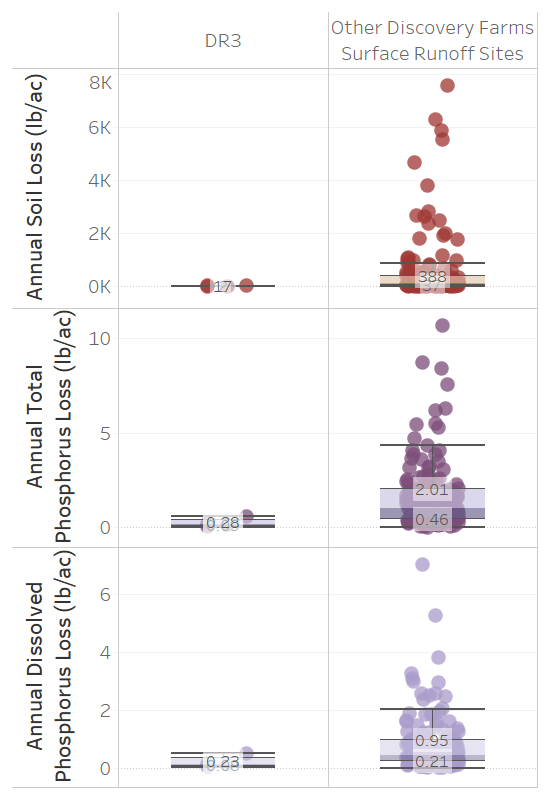
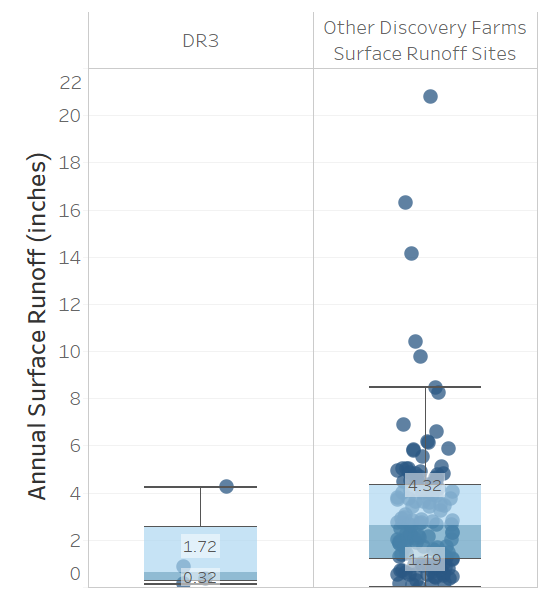
Figures 2. Boxplots of annual nutrient losses and annual surface runoff volume at the CRP site (DR3) compared to all other DF surface runoff sites. Annual dissolved phosphorus loss, shown in light purple, compares a median value of 0.23 lb/ac on the CRP acres (DR3) to a range of 0.21 – 0.95 lb/ac on all other Discovery Farms surface runoff sites. Annual total phosphorus loss, shown in dark purple, compares a median value of 0.28 lb/ac on the CRP acres (DR3) to a range of 0.46-2.01 lb/ac on all other Discovery Farms surface runoff sites. Annual soil loss, shown in red, compares a median value of 17 lb/ac on the CRP acres (DR3) to a median of 388 lb/ac on all other Discovery Farms runoff sites. Annual surface runoff, shown in blue, compares a range of 0.32- 1.72 inches on the CRP acres (DR3) to a range of 1.19-4.32 inches on all other Discovery Farms runoff sites.
Losses Were Not Zero
At the CRP field (DR3), a site that has had constant grass cover and no nutrient applications for over 10 years, losses were low but not zero. Low runoff and low- to mid-nutrient concentrations resulted in low annual nutrient losses.
The site experienced less runoff than other Discovery Farms edge-of-field sites. Nitrogen and soil concentrations were also lower than at other surface sites. While phosphorus concentrations in the runoff were similar to agricultural sites, the low runoff volume means that the annual cumulative phosphorus losses were lower than agricultural sites.
Expand Conservation Planning
Both of these nonagriculture sites produced runoff and were sources of soil and nutrients; losses were not zero. In the case of the ravine, we know that runoff containing soil and nutrients entered the ravine from a pasture uphill. The field in CRP received no inputs but has high phosphorus levels. The CRP field illustrates that even a field without crops, nutrient application, or agriculture activity of any kind can still have runoff and nutrient losses, though they are lower than agriculture sites. Phosphorus in particular remains high in the field and can be lost through runoff, suggesting that a goal of zero phosphorus loss for any system is likely impossible.
However, both sites also acted as water quality protection in one way or another. The CRP land produced fewer nutrients and soil than the ag land sites in the watershed, and the ravine took in more nutrients than it released for most of the years. This supports advocacy for adding or improving non-ag lands as part of a conservation program on a farm to improve water quality protection.
Where cropland and non-cropland meet is the last line of defense to protect against soil loss. At the top of a wooded ravine like JV3, erosion can create a gully head and begin to erode fields. Areas that transition to or from wooded ravines often need large, well-defined waterways or grade stabilization structures to slow water and capture soil.
Soil loss risks should be evaluated for all land, not just cropland. Including these areas when doing a field walkover, such as described in the Discovery Farms Field Walkover Guide, provides a more accurate picture of nutrient loss risks and helps prioritize the next steps in nutrient management.
Published: May 7, 2026
Reviewed by: Amber Radatz and Guolong Liang