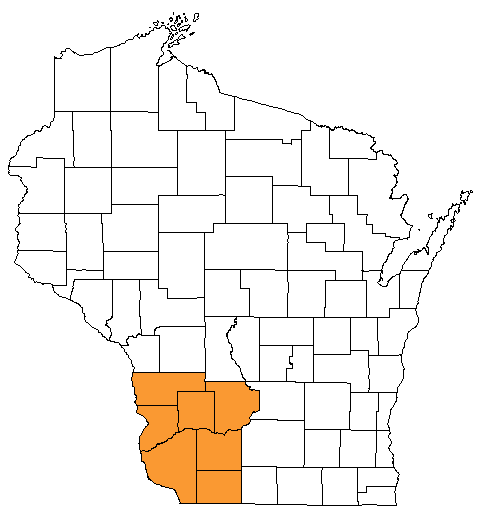
Region counties: Vernon, Crawford, Richland, Sauk, Grant, Iowa, and Lafayette.
Soil types evaluated: Newglarus silt loam 12-20% slopes, Fayette silt loam 6-12% slope, and Palsgrove silt loam 6-12% slope.
High Potential for P Losses
Southwest Wisconsin is home to the winding valleys and ridgetops of the Driftless region, and agriculture fields with more slope than other parts of the state. This presents a challenge for agriculture water quality. When soils are disturbed and residue cover is low, the area is prone to extreme erosion and the phosphorus loss that comes with it. For example, for a continuous corn silage system managed with chisel-disk tillage, mean estimated P loss was 25 lb/acre/year from a common soil in this region, Fayette silt loam with 6-12% slope. Other rotations (corn-soybean, corn silage-alfalfa, grazed pasture, etc.) had lower losses, assuming similar tillage and nutrient management. Without any conservation practices, losses in the southwest and west central regions are much higher than other regions, but this is also an opportunity for improvement. Absolute decreases in estimated P loss following the application of any of the conservation practices below are much greater in the Driftless than other regions. Changes made here, in the Southwest, could have a profound impact on its world-class trout streams and recreational rivers providing economic benefit to the surrounding communities.
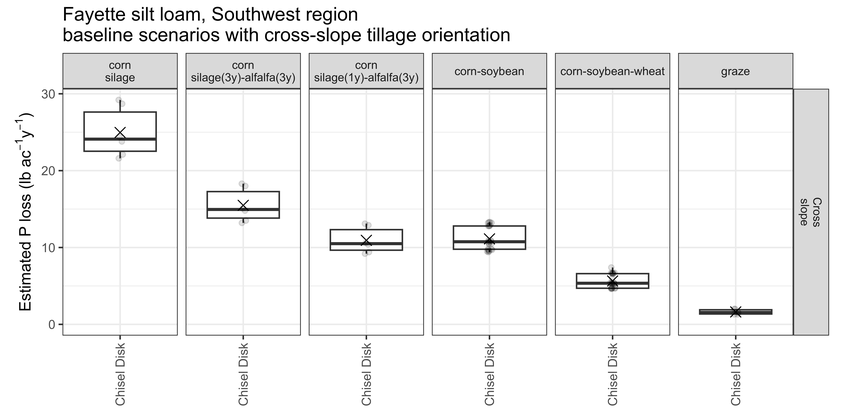
All scenarios below were assessed alone, with no other conservation practices in place. Aside from reduced tillage assessment, the other practices were evaluated with chisel-disk tillage management. All were assessed with the three most common soil types in the region: Newglarus silt loam 12-20% slope, Fayette silt loam 6-12% slope, and Palsgrove silt loam 6-12% slope.
Reducing Tillage: A Win for Erosion Control and P Loss
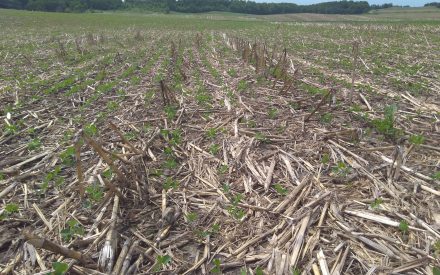
Reducing tillage was the single largest P loss reduction possible across scenarios of different management, soils, and slopes in southwest Wisconsin. In a corn grain-soybean rotation, going from a chisel-disk tillage program to a no-till program reduced P loss by an average of 11.4 lb/ac/y (Figure 3.19 and Table 3.3). That represents a percentage reduction of 89%. The total value of P reduction is even higher in continuous corn silage, with a reduction of 17.9 lb/ac/y, but represents a smaller percentage reduction at 63% (Figure 3.42). This is because baseline losses for corn silage are much higher than the corn-soybean rotation (Figure 3.92). No-till offers the greatest reduction, but even strip till reduces total P losses by 35% to 80% as compared to chisel-disk. This is no surprise, conservation tillage reduces erosion, and the phosphorus bound up in soil remains on the field.
Filter Strip: Catch P Before it Leaves the Field
A 30-ft-wide perennial grass filter strip was highly effective in decreasing P losses, regardless of soil type. In a corn grain-soybean rotation, adding a filter strip reduced P loss by an average of 10.4 lb/ac/y (Figure 3.21 and Table 3.3). That value increased in a continuous corn silage rotation to 23.1 lb/ac/yr (Figure 3.44 and Table 3.6). Both rotations saw a decrease in estimated P loss of 80%. In the southwest, even with no other practices, adding a filter strip reduced losses to under 3.6 lb/ac/yr, except for in continuous corn silage or a corn silage (3 yr)-alfalfa (3 yr) rotation, where losses were as high as 7.5 and 7.1 lb/ac/yr, respectively. But in those two rotations, adding only a filter strip was more effective at reducing P loss than switching to no-till.
While filter strips work differently than in-field practices like reduced tillage or changing rotations, they keep phosphorus from exiting agricultural acres by trapping it. In steep topographies like the southwest, heavy precipitation can overwhelm in-field conservation practices and produce runoff. A filter strip provides an extra barrier which slows that runoff and traps the soil and phosphorus within it before it enters nearby waterways.
Rotation Changes: Cover the Soil and Slow Loss
Adding wheat into a corn grain-soybean rotation reduced P losses by an average of 6.3 lb/ac/y, representing a 49% reduction (Figure 3.22 and Table 3.3). Changing from continuous corn silage to a silage-alfalfa rotation, with 3 years in each, reduced P losses by an average of 10.5 lb/ac/y, representing a 37% reduction (Figure 3.46). Adding wheat or alfalfa to a rotation reduced the average and variation in estimated P losses, though not as much as reducing tillage or adding a filter strip. Estimated P losses could still exceed 30 lb/ac/yr in a silage-alfalfa (3 yr each) rotation for some soils in Southwest WI. Reducing the corn silage from 3 years to 1 year was able to further reduce estimated P losses, but the average exceeded 10 lb/ac/yr. This indicates an opportunity for additional practices to further reduce losses. In the scenarios with wheat added, wheat straw remained in the field, with the residue acting as a soil cover. If wheat straw is removed and baled, the benefits in estimated P loss reduction would disappear unless a cover crop were planted after wheat harvest.
Cover Crops: Effectiveness Depends on Planting
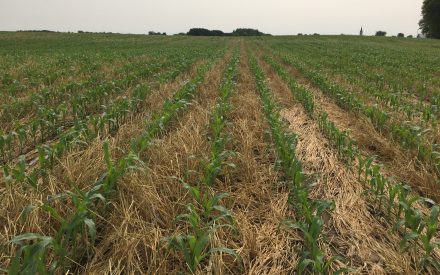
Cover crop P loss reductions varied according to planting time/method. In the Southwest, in a corn-soybean rotation, the October drilled rye cover crop did not reliably decrease P losses, which even increased in some cases. Increases occurred for scenarios with fall-applied nutrients, which were not incorporated by tillage due to the presence of the cover crop, and were therefore more vulnerable to loss. The September drilled cover crop decreased estimated P losses by 2.2 lb/ac/yr, while the August aerial seeded cover crop decreased losses by 6.5 lb/ac/yr; a 59% reduction compared with no cover crop. Other rotations that included corn also had greatest P loss reduction from the August aerial seeded cover crop This treatment was most effective in decreasing P losses because it maximized time for biomass production prior to winter and early spring, when most P losses tend to occur in our region.
Caveats and Upshot
All of the practices included here are effective at reducing total P loss, however, they do so by reducing erosion and soil loss, which addresses only one form of phosphorus. There is another form, dissolved phosphorus, which can only be addressed by reducing soil phosphorus levels. Drawing down soil test phosphorus (STP) is a long term process and it can take 8-15 years to reduce STP by 50% with no additional phosphorus inputs. With commitment though, phosphorus drawdown is an effective and critical conservation practice in fields with extremely high STP.
The Southwest is a region particularly vulnerable to soil and P loss, but this evidence shows that it could also be a leader in reducing those losses by implementing practices like no-till and filter strips. Not every region has the ability to add a practice and reduce estimated P losses by such high margins. Using the information above to prioritize practices with the highest estimated improvements could have a profound impact on the surface water quality of this region.
Updated: Sept. 15, 2026
Reviewed by:
Dr. Steven Hall, Associate Professor and Extension Specialist, Department of Plant and Agroecosystem Sciences, UW-Madison