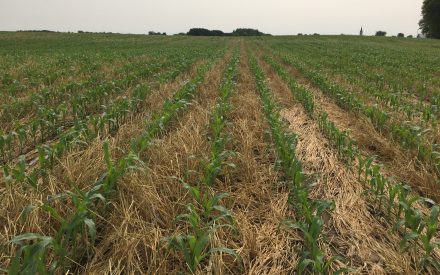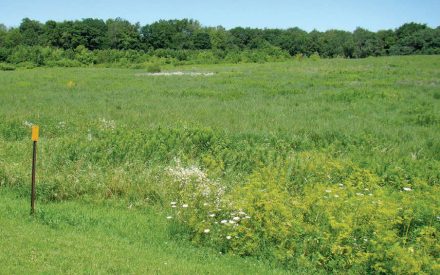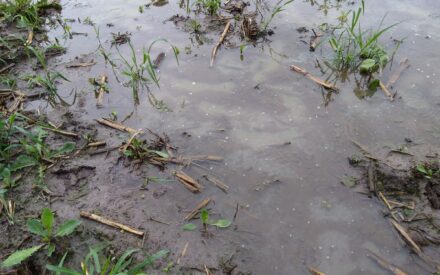
This article shares results from a Discovery Farms study that was conducted in cooperation with USDA-NRCS. Data from 2018-2024 is included. Monitoring is ongoing at these sites.
Sometimes small areas on the landscape can have a big influence on downstream water quality. Certain areas of farm fields can be more susceptible to soil erosion, leading to greater sediment and nutrient losses to nearby lakes and rivers. Areas where the natural topography causes runoff water to come together in a temporary stream are particularly vulnerable. Grassed waterways are a classic conservation practice that can help protect these sensitive areas while safely moving water off the field. New research from Discovery Farms demonstrates that grassed waterways can significantly reduce soil and nutrient losses from crop fields.
Early Results Brought Surprises
Discovery Farms began monitoring two fields on different dairy farms in Kewaunee County in the fall of 2018. Runoff water was collected year-round at a monitoring station located at the edge of each field to determine the amount of water, soil, and nutrients leaving the field. The original goal of the study was to better understand how soil conservation practices affect soil and nutrient losses from dairy forage rotations in northeast Wisconsin. Cropping practices were similar between the two farms, and corn silage was the most common crop grown during the study (Table 1).
| Water Year | 2018 | 2019 | 2020 | 2021 | 2022 | 2023 | 2024 |
|---|---|---|---|---|---|---|---|
| Farm 1 | Corn Silage | Corn Silage | Corn Silage | Corn Silage | Corn Silage | Wheat | Alfalfa Mix |
| Farm 2 | Corn Silage | Corn Silage | Soybean | Corn Silage | Corn Silage | Corn Silage | Annual Rye Grass |
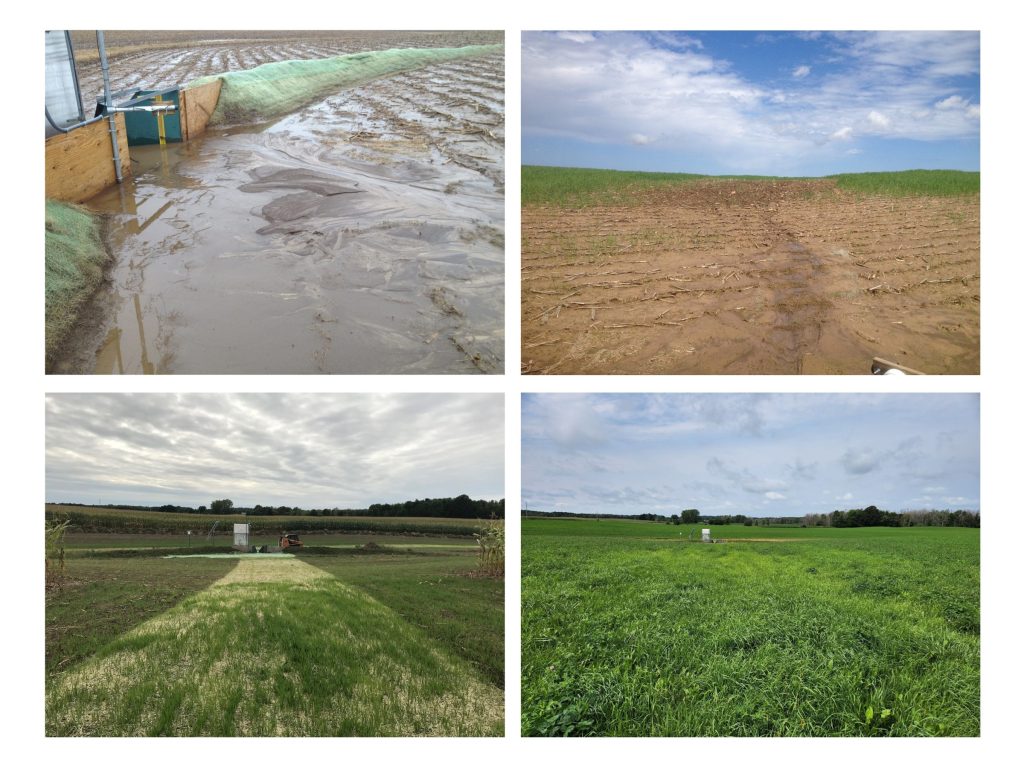
Both study fields had been managed in no-till for many years before monitoring began and overwintering cover crops were consistently used following the annual crops included in the rotation. Despite these soil conservation practices, substantial soil loss was measured at the sites in the spring and early summer of 2019. For one of the farms (hereafter “Farm 1”), field walkovers revealed sheet erosion in a small area where runoff water converged as it flowed off the field. At the other site (“Farm 2”), there was evidence of gully erosion within and near the existing waterway.
The following summer (August 2020), both farms partnered with NRCS to either install a new grassed waterway (Farm 1) or renovate the existing waterway (Farm 2). Discovery Farms monitoring continued at the sites, providing two years of edge-of-field water quality data before the waterways were installed or renovated and four years after. With these data, we can test if the grassed waterways reduced soil and nutrient losses in surface runoff.
Observations Before and After Waterway Work
The two years of monitoring before the waterways were established or renovated had above average precipitation while the time period after captured a mix of wet and dry years (Figure 1, top). Despite differences in annual precipitation over the monitoring period, there were not any significant differences in runoff volumes measured at each field before and after the waterway work. Both time periods included a mix of large and small runoff events (Figure 1, bottom).
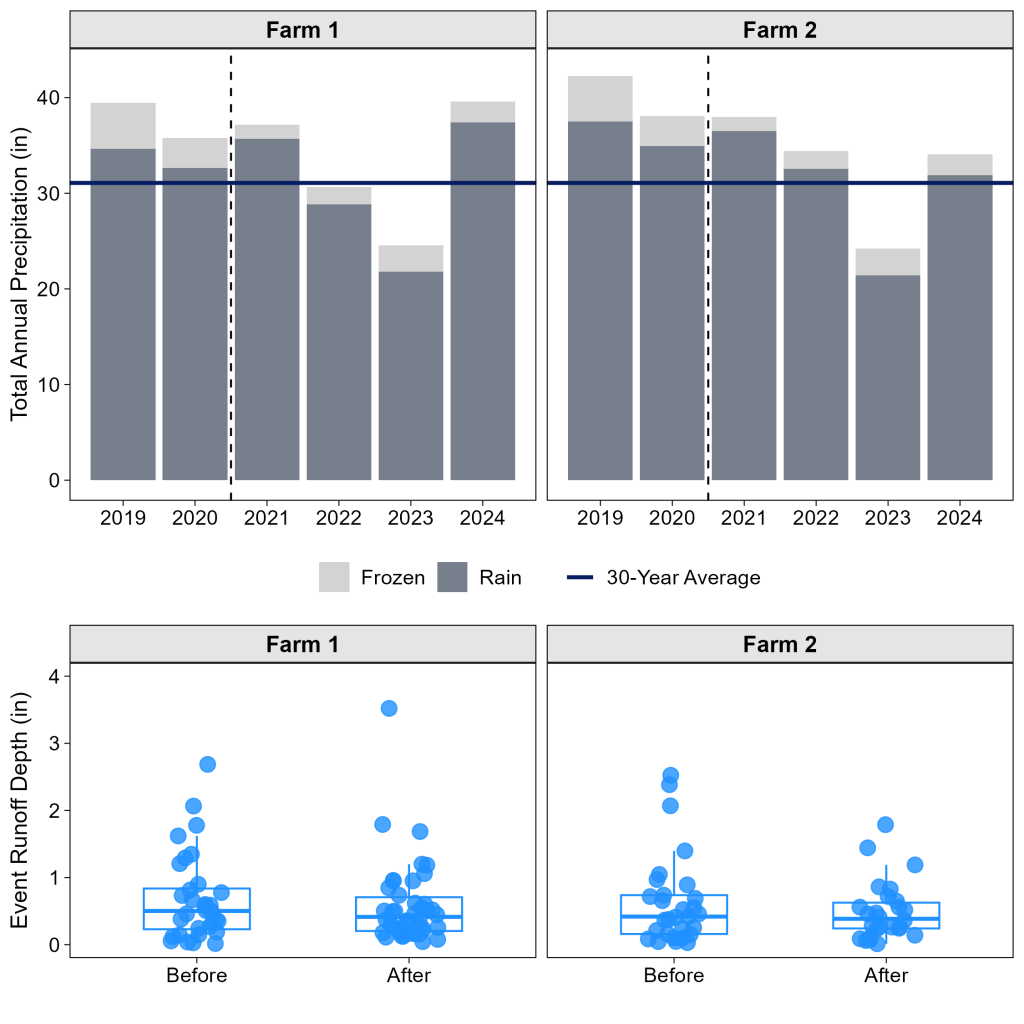
Image Description ↓
Four-panel scientific figure. Top row shows two stacked bar plots for Farm 1 and Farm 2 with annual precipitation totals from 2019-2024. The y‑axis is labeled “Total Annual Precipitation (in)” and the x‑axis shows the year. The bars are divided into dark and light gray portions to show the contribution of rain versus frozen precipitation, respectively. Rain makes up the majority of annual precipitation. There is a horizontal blue line at around 31 inches, marking the 30-year average precipitation for the region. A dashed vertical line separates 2020 and 2021, noting when the grassed waterway was installed at Farm 1 and renovated at Farm 2. Precipitation totals for most years are at or above the average except 2023, which is notably below average at both farms. Farm 2 generally has slightly higher precipitation totals than Farm 1.
Both sites had elevated annual losses of soil, phosphorus, and nitrogen before the waterway work (Figure 2). Most of the phosphorus losses were in a particulate form, and nitrogen losses were predominantly organic nitrogen. This pattern suggests that the nutrient losses were due to soil erosion. Losses were lower following the waterway work, but the differences were more pronounced at Farm 1 where the new waterway was installed compared to Farm 2 where the existing waterway was renovated.
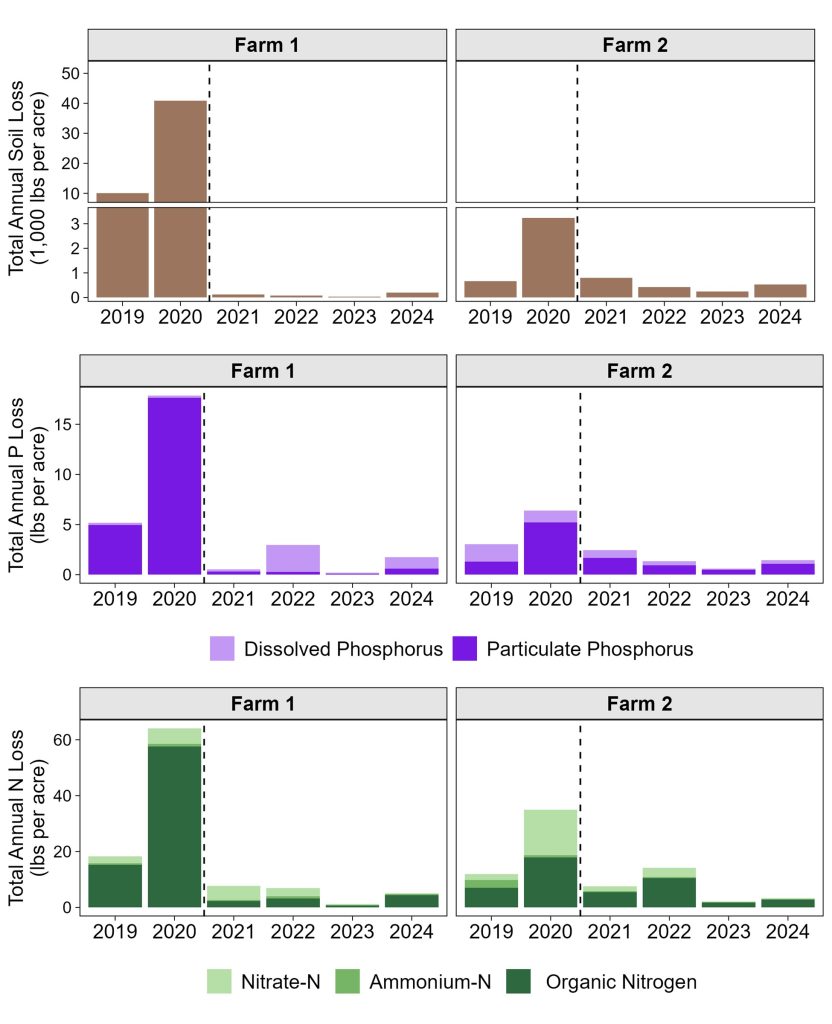
Image Description ↓
Six-panel figure comparing annual soil, phosphorus (P), and nitrogen (N) losses from Farm 1 and Farm 2 from 2019-2024. On each panel, a dashed vertical line between 2020 and 2021 marks when the grassed waterway was installed at Farm 1 or renovated at Farm 2.
The top row has two barplots of annual soil loss at Farm 1 and Farm 2. The y-axis is labeled “Total Annual Soil Loss (1,000 lbs per acre)”, and the x-axis shows the year. Farm 1 shows high losses in 2019 (around 10,000 lbs per acre) and especially 2020 (around 41,000 lbs per acre), followed by near-zero losses from 2021-2024. Farm 2 shows lower losses overall, peaking in 2020 at around 3,000 lbs per acre and remaining lower thereafter.
The middle row shows two stacked barplots of annual phosphorus losses at each farm. The y-axis is labeled, “Total Annual P Loss (lbs per acre)”, and the x-axis marks the year. The bars are divided into dark and light purple portions to show the contribution of particulate versus dissolved phosphorus, respectively. Both farms peak in 2020, with Farm 1 reaching about 18 lbs per acre and Farm 2 about 6 lbs per acre. Losses are substantially lower from 2021-2024. Particulate phosphorus makes up the majority of annual phosphorus losses most years.
The bottom row shows two stacked barplots of annual nitrogen losses at each farm. The y-axis is labeled, “Total Annual N Loss (lbs per acre)”, and the x-axis marks the year. The bars are divided into dark, medium, and light green portions to show the contribution of organic nitrogen, ammonium, and nitrate, respectively. Nitrogen losses are highest in 2020 at both farms, approximately 64 lbs per acre at Farm 1 and 35 lbs per acre at Farm 2. Losses decline markedly after 2020, remaining comparatively low through 2024. Organic nitrogen makes up the majority of total nitrogen losses most years.
New Grassed Waterway Significantly Reduced Soil and Nutrient Losses
Although the observed water quality data showed stark improvements following the grassed waterway work, attributing these water quality improvements to the waterways requires additional analyses. Statistical models were used as a tool to further test the water quality effects of the grassed waterway addition or renovation at each farm. These models accounted for other factors that can affect soil and nutrient transport including time of year and runoff volume. Accounting for these environmental conditions helps isolate the effect of the waterways.
The model results validated that there were significant reductions in soil, phosphorus, and nitrogen losses after the grassed waterway addition at Farm 1 (Table 2). Accounting for differences in runoff magnitude and timing, the models suggest that event soil losses were over 97% lower, total phosphorus losses were 75% lower, and total nitrogen losses were about 72% lower following the grassed waterway addition. These model estimates align well with the water quality improvements measured in the field.
| Water Quality Variable | Estimated Reduction | Estimated Range of Reduction |
|---|---|---|
| Soil Loss (lbs per acre) | ↓ 97.6% | ↓ 93.4 – 99.1% |
| Total Phosphorus Loss (lbs per acre) | ↓ 75.0% | ↓ 51.8 – 86.9% |
| Total Nitrogen Loss (lbs per acre) | ↓ 72.4% | ↓ 40.8 – 87.1% |
Recipe for Success
Several factors contributed to the dramatic water quality improvements seen after the new grassed waterway installation and its continued success today:
- Waterway was designed and installed to the NRCS practice standard
- Good vegetative cover was established quickly in the new waterway
- The farm adjusted field operations to avoid damaging the waterway
- Continued use of in-field soil conservation practices (no-till, cover crops, perennial forage in rotation) reduces sediment loads to waterway, extending the time before renovation is needed
Although observed soil and nutrient losses were lower after the waterway renovation at Farm 2, these changes were not statistically significant. There are a few possible explanations for why the renovation did not result in the level of reductions observed at Farm 1. First, as a renovation of an existing waterway, reductions in sediment and nutrient losses are expected to be less dramatic than those seen with the installation of a new waterway on previously unprotected soil. Second, there were a few confounding factors related to in-field management at Farm 2 that may have obscured any effects of the renovation. Specifically, shortly after the waterway renovation, light tillage was used on the field for the first time in many years to address rutting, which could have led to increased soil disturbance. Additionally, in 2023 a portion of the waterway was accidentally sprayed during a herbicide application. This reduced the level of the waterway’s protection and reestablishment efforts were unsuccessful during this study period.
Waterways Help with Late Winter Challenges
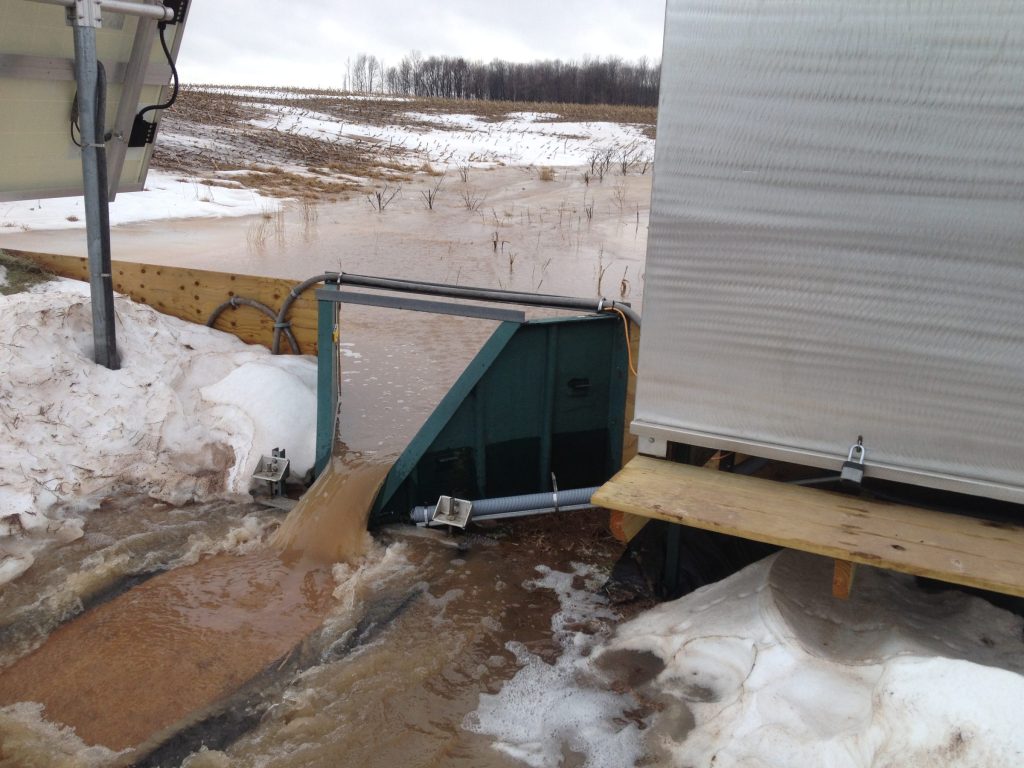
Late winter consistently brought higher runoff volumes and associated soil and nutrient losses at both sites. Specifically, March had disproportionate contributions to annual runoff (41-50% on average across the monitoring period), soil (34-46%), phosphorus (40-45%), and nitrogen losses (40-45%). This is a common pattern observed at Discovery Farms sites across Wisconsin. Late winter usually brings weather and soil conditions that make larger runoff events likely. Soils often have limited infiltration capacity this time of year due to thawing frost and high moisture content. As a result, much of the water from snowmelt and spring rains flows off the field.
Practices that protect the soil and reduce available nutrients in this late winter period can have outsized water quality benefits. Both farms in this study were already implementing conservation practices that help reduce late winter water quality risks including no-till, overwintering cover crops, and storing manure during this period. The addition and renovation of grassed waterways at these sites will further protect the fields during late winter. The waterways will help move excess water from rain and snowmelt off the fields while providing perennial vegetative cover in the most vulnerable areas for soil erosion.
Bottom Line
This study demonstrates that targeted conservation in small areas of a field can yield big benefits for downstream water quality. When the project started, both farms were already using no-till and overwintering cover crops to manage in-field erosion. However, the full water quality benefits of these conservation practices were being undermined by small areas of the fields that remained vulnerable to sheet or gully erosion. Adding or renovating grassed waterways in these sensitive areas dramatically reduced the amount of soil, phosphorus, and nitrogen leaving the fields in surface runoff. The waterways will likely benefit from the in-field conservation practices already used by each farm as these practices will reduce the sediment load that the waterways receive, extending the time before reshaping is needed. Where they are needed, grassed waterways have tremendous potential for reducing soil erosion and cropland nutrient losses.
Farm Resources
Regular field scouting can help detect and address soil erosion concerns. The Discovery Farms Field Walkover Guide provides a step-by-step approach to identifying vulnerable spots and setting priorities to manage these erosion-prone areas. If you’re unsure where to begin, your regional Agricultural Water Quality outreach specialist would be happy to help!
Thank You
Discovery Farms work is only possible through the support of participating farmers, project partners, funders, and the Discovery Farms Steering Committee. This project was conducted in cooperation with the Natural Resources Conservation Service, Door Kewaunee Demonstration Farm Network, the United States Geological Survey, and the Kewaunee County Land & Water Conservation Department with funding for the project from the Great Lakes Restoration Initiative and Dairy Farmers of Wisconsin.
Aug. 6, 2026
Reviewed by: Lindsey Hartfiel, Aaron Wunderlin