Abstract
This study evaluates agricultural conservation practices for potential P loss reductions, considering the unique regions, soils, and cropping systems of Wisconsin. For reducing total P losses, four practices were particularly effective: decreasing tillage intensity, adding edge-of-field filter strips, incorporating perennial or overwintering crops, and early establishment of cereal rye cover crops. Shifting from intensive tillage to no-till consistently offers high P reduction, even on soils with high soil test P. Case studies emphasize that grassed waterways can significantly decrease total P losses in erosion-vulnerable fields, and avoiding winter manure application reduces the risk of P runoff. While most strategies target soil-bound P, long-term soil-test P drawdown through decreased P fertilizer application is uniquely effective at reducing dissolved P losses. Overall, this study highlights the potential benefits of controlling total P losses through a combination of in-field practices (tillage reduction and early planted cover crops), structural practices (filter strips and grass waterways), and cropping-systems changes (adding overwintering or perennial crops) in the most vulnerable fields.
Background
Agricultural lands are a major source of phosphorus (P) to surface waters. Numerous conservation and management practices have been proposed to address agricultural P losses, but their effectiveness can vary markedly, particularly when considering diverse soil types and agricultural systems of Wisconsin. This work is unique because it is the first known systematic examination of various cropland management combinations tailored specifically to 9 different regions of the state.
Goal
Evaluate potential benefits of agricultural practice changes in decreasing P losses in surface runoff from Wisconsin’s croplands.
The results are valuable to farmers and farm advisors because the predicted reductions show the effectiveness of each practice for P loss reduction tailored by specific regions and soil types in Wisconsin. For the greatest benefit, locate fields with high baseline P losses, such as those with highly erodible soils or low residue cover, and use these results to identify where and when specific practices (or combinations) are most effective for P loss reduction. A range of combinations of practices can also be explored in an online tool under development.
The report shows that no single practice is universally “best” for every situation. Instead, practitioners are encouraged to weigh logistical, economic, and environmental trade-offs for each specific field and cropping system.
Methods
In this report, we used two main approaches to evaluate potential benefits of agricultural practice changes in decreasing P losses in surface runoff from Wisconsin’s croplands.
First, researchers from UW-Madison used the Wisconsin Phosphorus Index (P Index), a model that has been calibrated specifically for Wisconsin’s crop and landscape characteristics with hundreds of site-years of on-farm measurements from commercial and research farms across Wisconsin. Using the SnapPlus software, researchers modeled over 300,000 unique field-scale scenarios, which strategically span a vast range of soil types, climate regions, and management conditions across the state. Science assessments in other states have typically reported broad geographic averages with high variability for different practices. A benefit of this report’s modeling approach is the ability to identify the specific contexts where different practices are effective. The results in this research brief highlight the percent reduction in P loss relative to baseline scenarios, but the full report also shares the raw estimated P losses in lb ac-1 y-1 (i.e. estimated average annual surface runoff P losses at the field edge).
Second, surface P runoff data collected from the Wisconsin Discovery Farms program, and data from other Wisconsin runoff studies published in scientific literature, were used to provide context and targeted assessment of additional management practices. By integrating on-farm research from the Discovery Farms program, the results provide a “reality check” for the model and offer context on how practices perform on specific farms.
Results
Step 1 in reducing P loss: Reduce erosion. Four practices offer particularly high potential for reducing total P losses:
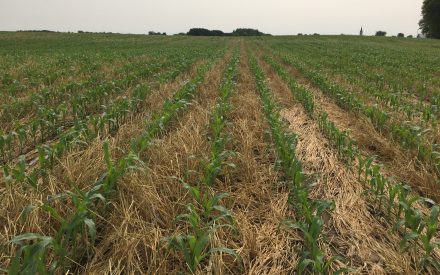
- Decreasing tillage intensity. This creates less surface disturbance and more residue cover. Compared with chisel-disk tillage, P loss reduction was greatest for no-till, followed closely by strip till. Vertical till provided less benefit.
- Adding a perennial grass buffer (filter strip) or a grass waterway. These slow down water and trap sediment, reducing P losses.
- Adding an overwintering or perennial crop (e.g., winter wheat or alfalfa) to an annual crop rotation, or converting annual rotations to perennial systems (e.g., pasture). Increasing perenniality creates more living roots and soil cover and protects soil from disturbance outside the period of corn and soybean growth.
- Adding an early-seeded winter rye cover crop. Getting the cover crop on early enough to establish enough biomass is key.
Of these practices, shifting from more intensive tillage (e.g., chisel-disk) to no-till often had large P loss reduction across regions and cropping systems, and shifting from chisel-disk to strip-till also had large benefits. For some cropping systems and soils, filter strips achieved even greater P loss reduction than a decrease in tillage intensity. When comparing among cropping systems, well-managed grazed perennial pastures generally had lowest P losses; aside from pasture, adding alfalfa in rotation with corn silage, or winter wheat in rotation with corn and soybean, could also decrease P losses from existing forage or grain cropping systems. Effectiveness of a cereal rye cover crop for P loss reduction varied markedly with planting date. Aerial seeding of rye into an existing crop canopy in August generally had high P loss reduction potential and often approached values for no-till or filter strips. In contrast, drill-seeding rye in October did not decrease P losses in most cropping systems and soils, and while drill-seeding rye in September often decreased P losses, this practice would be difficult to implement for many cropping systems.
Model results showed that timing of manure application (spring or fall) and nutrient form (liquid dairy manure vs commercial fertilizer) had less impact on P loss when these P inputs were incorporated with tillage. When they were surface applied to no-till or cover cropped soils, spring application often decreased P losses as compared with fall application. Scenarios did not include manure spreading on frozen soil. A Discovery Farms case study found that spreading on non-frozen soils reduces P losses compared to spreading on frozen soils.
Step 2 in reducing P loss: Once erosion is controlled, gradual P draw-down in fields with high or excessively high soil P content is the only consistent way to reduce dissolved P loss.
Lowering soil P content became increasingly important for achieving further P loss reduction for systems with lower baseline P losses, and was the only practice evaluated that consistently decreased dissolved P losses.
The simulations indicated that relatively low P losses could potentially be achieved across most soils, regions, and cropping systems examined here by adopting combinations of multiple practices that decreased soil disturbance and increased plant biomass and residue cover.
Combinations of the four most effective conservation practices almost always led to greater P loss reduction than a single practice alone. The first practice implemented resulted in the greatest P loss reduction, but the second practice still helped to further reduce P losses.
For particularly vulnerable soils and cropping systems (e.g., high slope, low residue cover), multiple practices would often be needed to achieve strict water quality goals.
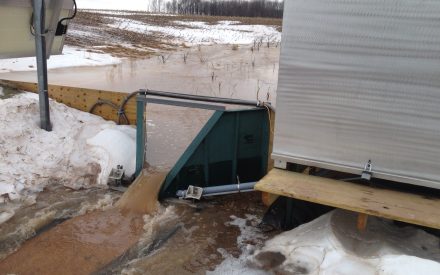
Controlling disproportionate soil losses from vulnerable areas of a field is crucial to get the maximum impact from multiple practices. In a Discovery Farms study, a field that had long-term no-till and cover crops still had high P losses due to a small concentrated flow path. Installing a well-designed grassed waterway reduced runoff event total P losses by 75%, on average.
Table 1.1 summarizes the primary practices evaluated in this report and their relative effectiveness in reducing runoff P losses. Although the effects of different practices varied across regions, cropping systems, and baseline conditions, several practices consistently had high potential for reducing P losses. General qualitative conclusions are presented in this table. Numerical summaries are provided along with greater context in the full report. Notice that most practices are not effective in reducing dissolved P loss, except reducing soil test P over long periods of time. Learn more about caveats identified in each practice in the full report.
| Practice | Category | Relative P Loss Reduction Potential | Caveats |
|---|---|---|---|
| Tillage reduction (P index model) | No-till, strip-till, or vertical-till vs. chisel-disk tillage | Higher (no-till, strip till), lower (vertical till) | Ineffective for dissolved P |
| Filter strip (vegetated buffer) (P index model) | Filter strip vs. none | Higher | Ineffective for dissolved P |
| Grassed waterway (Discovery Farms data) | Grassed waterway vs. none | Higher | Only applicable to fields with gully erosion; ineffective for dissolved P |
| Winter rye cover crop (P index model) | Oct.drill-seeded, Sept. drill-seeded, or Aug. aerial-seeded vs. none | Higher (Aug. aerial seeded), lower (Sept. drill planted), inconsistent (Oct. drill planted) | Ineffective for dissolved P; assumes consistent cover crop establishment, which is difficult to achieve |
| Winter rye cover crop (Discovery Farms data) | October drill-seeded vs. none | Inconsistent | |
| Diversified rotation / perennial cover (P index model) | Corn-soybean wheat vs. corn-soybean, corn silage-alfalfa or grazed pasture vs. corn silage, grazed pasture vs. corn silage-alfalfa | Higher | Ineffective for dissolved P; wheat scenarios included straw retention |
| Soil test phosphorus reduction (P index model) | 100, 50, 25 ppm | Higher to lower | More effective for soils with excessively high P. Effective for reducing dissolved P loss, but requires many years of low P inputs to achieve |
| Nutrient form (P index model) | Liquid dairy manure vs. commercial fertilizer | Inconsistent | |
| Nutrient application timing (P index model) | Spring vs. fall | Lower to inconsistent | Effectiveness varied with tillage practices; spring application was more beneficial when fall-applied nutrients were not incorporated through tillage, such as in no-till and cover-cropped fields |
| Nutrient application timing (Discovery Farms data) | Non-frozen soil vs. frozen soil | Higher | |
| Manure placement (Discovery Farms data) | Subsurface vs. surface | Inconsistent | Other practices (tillage, cover crop) co-varied with manure placement |
Grounded in Measured Data
Analysis of P runoff data from Discovery Farms sites provided further insight on the P loss reduction from grassed waterways, changes in manure placement and timing, and cover crops.
- In one case study where a well-designed grassed waterway was installed in a field with long-term no till and cover crops, runoff event total P losses decreased by 75%, on average. This case study highlighted the significance of controlling disproportionate soil losses from vulnerable areas of a field.
- A second case study analyzed the relationship between manure application and P loss across 14 farms and 671 runoff events. Manure applications on non-frozen soils were associated with 30% lower P losses in later runoff events, compared to manure applications on frozen ground, supporting the water quality benefits of avoiding winter manure spreading. Interestingly, there was no consistent difference in runoff event P loss following surface-applied manure and injected or incorporated manure, highlighting the potential trade-offs in dissolved and particulate P losses associated with manure placement. Runoff events occurring shortly after manure application tended to have higher P losses, but the overall relationship was relatively weak—that is, there was only a 20% reduction in runoff event P load for each year since P application.
- A third case study evaluated the impact of an October drilled cereal rye cover crop in a corn-soybean rotation, and found no measurable benefit of this practice for P-loss reduction, consistent with predictions from the P-index modeling (late seeded cover crops can have other benefits, however, like decreasing nitrogen losses).
Conclusion
Overall, the results highlight the potential benefits of first controlling total P losses through a combination of in-field practices (e.g., tillage reduction, early planted cover crops), structural practices (filter strips and grass waterways), and cropping-systems changes (adding overwintering or perennial crops) in the most vulnerable fields. After addressing soil loss, gradual P draw-down in fields with high or excessively high P content can further decrease P losses, particularly the dissolved P component, along with optimization of form and timing of P application. In ongoing work, our team will continue to update this document in response to new data and stakeholder feedback, and we will begin to evaluate the effectiveness of agricultural practices in reducing nitrogen (N) losses.
Understanding Model Results
Here we provide an example of how to interpret the model results. A similar format is used throughout the report and regional highlights to present results from other soils, regions, and cropping systems.
This example evaluates estimated P losses across different tillage programs for a corn grain-soybean rotation on a St. Charles silt loam with 2-6% slopes in the South Central region (the most dominant agriculture soil type in the area). No other major conservation practices (e.g., cover crops) are included in these scenarios.
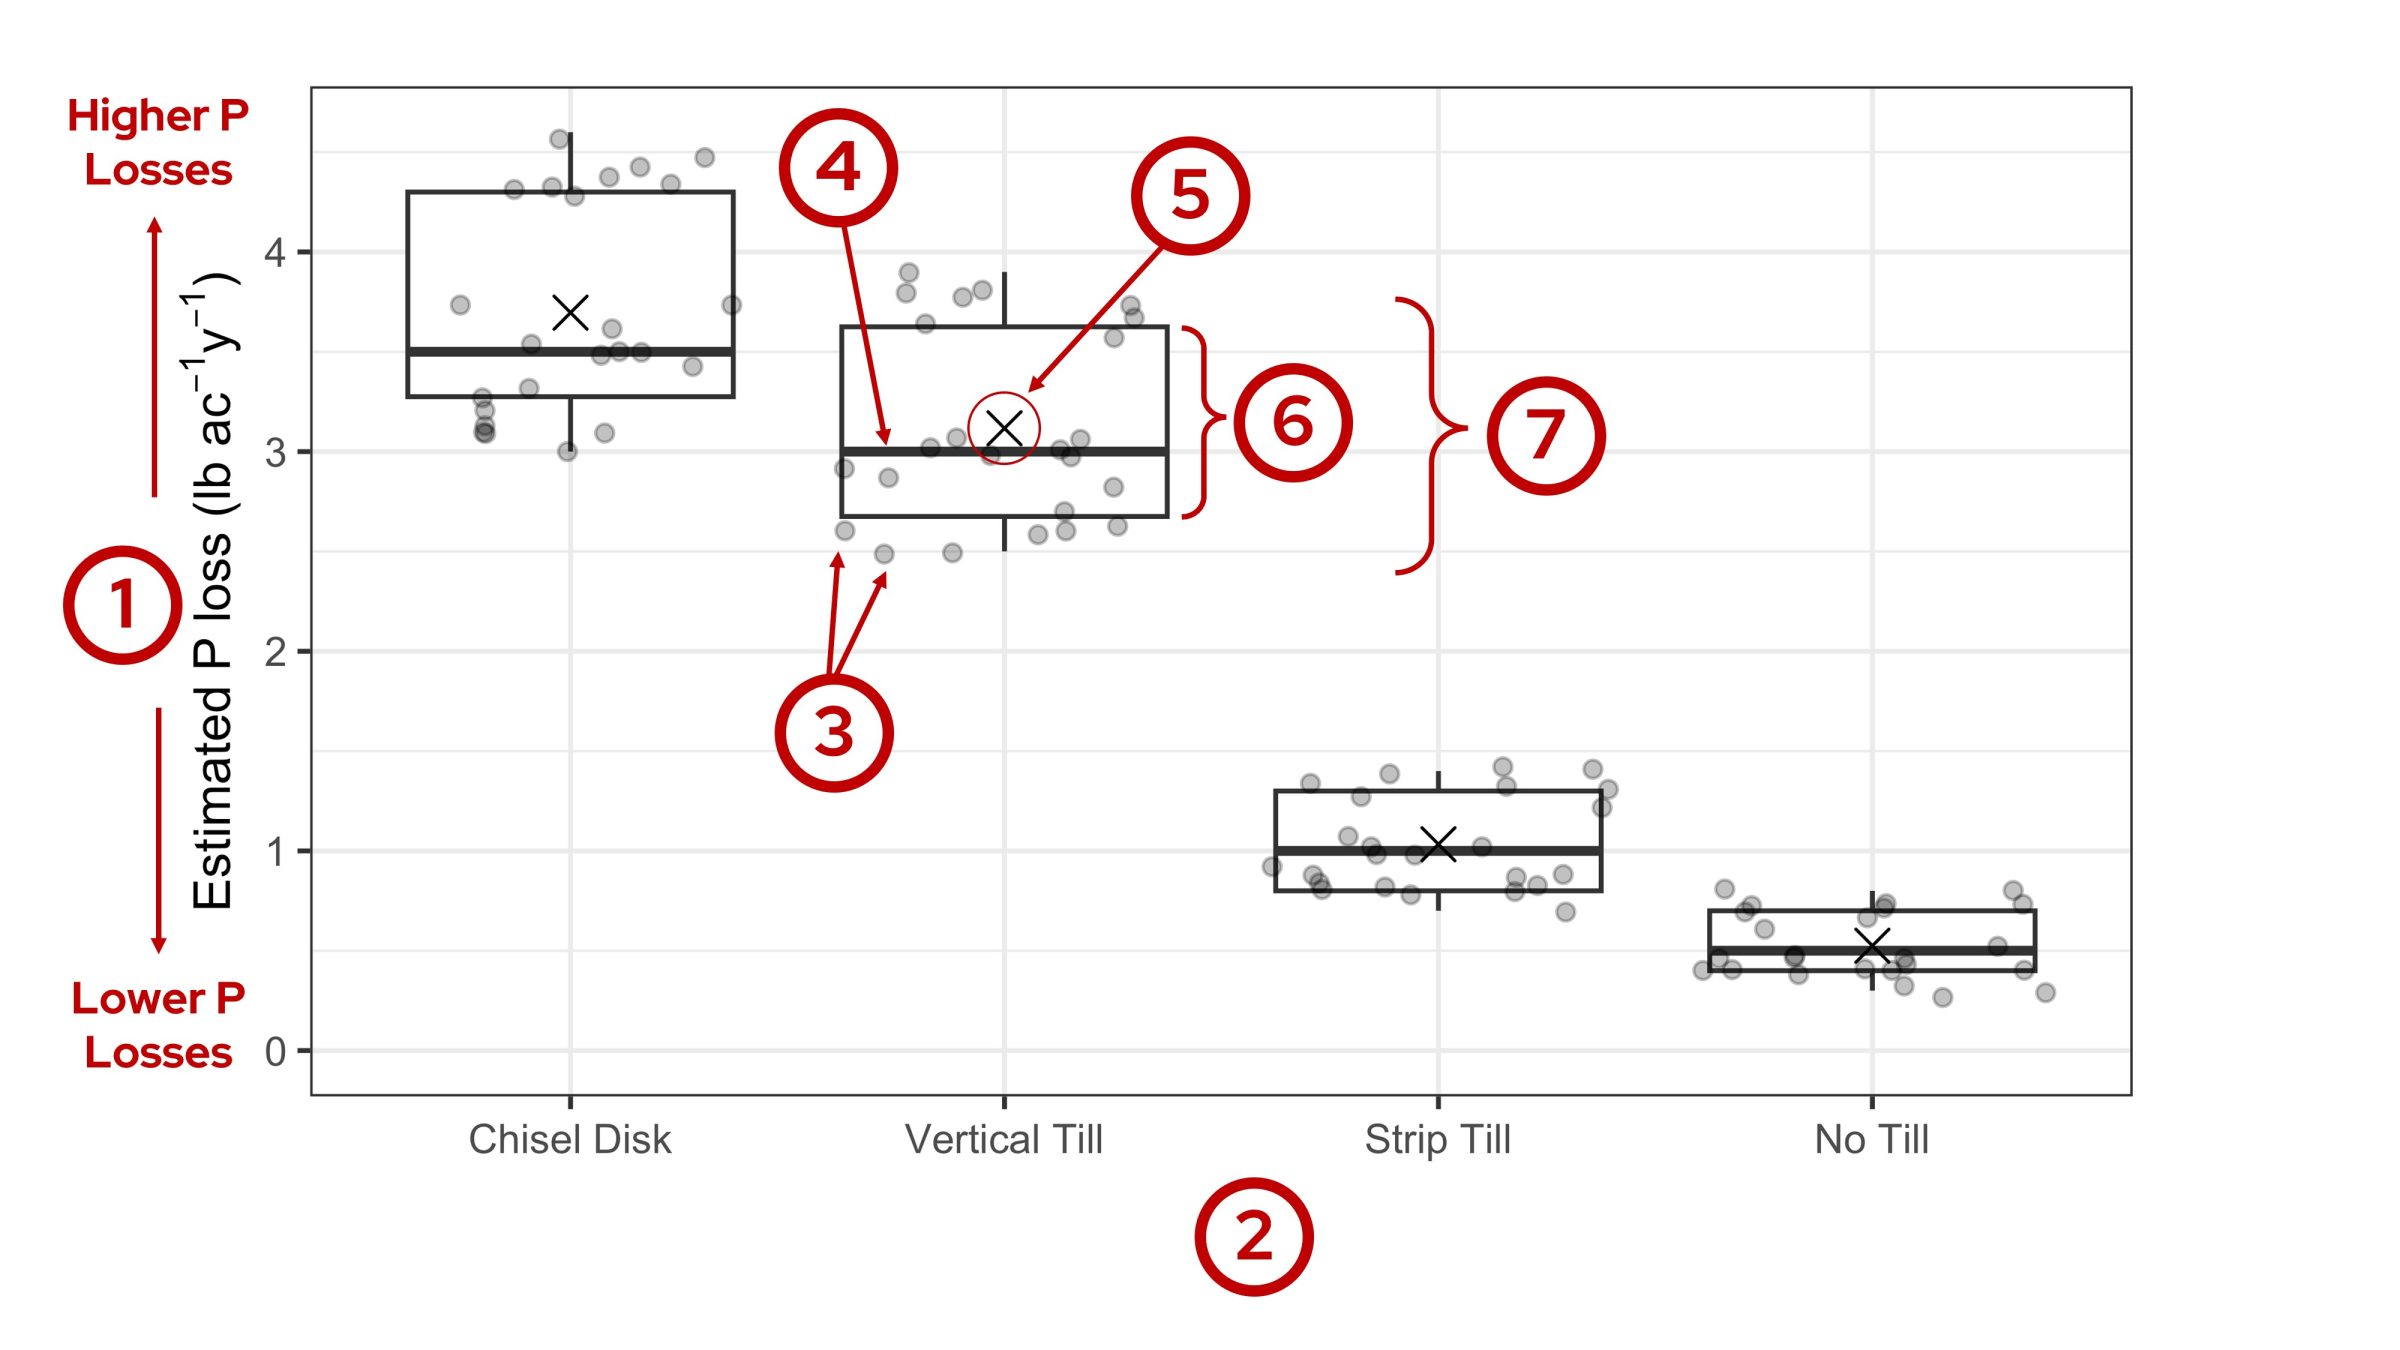
- Model Output: The model results for rotation-average (e.g., averaged across both corn grain and soybean phases), annual P losses at the field edge are plotted along the vertical axis. The goal is to identify practices that can lower these losses.
- Management Practices: P losses are compared across four levels of tillage intensity ranging from a 3-pass chisel disk system to no-till.
- Individual Points: Each point represents the results of one model scenario. There are multiple points within each tillage group because other management and site variables were tested. In this example, 24 different scenarios were tested per tillage group to allow for different approaches to P application timing (fall and spring); P source (manure and synthetic fertilizer); P application rate (maintenance and 20% lower than maintenance); and soil test P levels (25, 50, and 100 ppm).
- Median: The boxplots for each group summarize the spread of the data points. The thick line in the middle is the median or 50th percentile. This value is a good estimate of typical P losses for each group.
- Average: The X-mark on the boxplot shows the average for the group. In most cases, it is very close to the median value.
- Interquartile Range: The distance from the bottom to the top of the box shows the range from the 25th to 75th percentiles, respectively. This can be thought of as a typical range of P loss values for each group.
- Range: The entire length of the boxplot shows the full range of values observed from all modeled scenarios in each group.
Interpretation: Reducing tillage intensity reduced edge of field P losses, with the largest reductions seen when shifting from a chisel-disk system to no-till. Shifting from chisel-disk to strip-till also had large reductions. The variation in estimated P losses within a given tillage category, indicated by the height of the boxes, decreased with tillage intensity. Reducing tillage intensity is an effective approach to reducing P losses, even in soils with very high soil test P.
Reach out to the Agriculture Water Quality Program with any questions, comments, or collaboration opportunities for the science assessment.
Updated: Sept. 3, 2026
Reviewed by:
Dr. Steven Hall, Associate Professor and Extension Specialist, Department of Plant and Agroecosystem Sciences, UW-Madison
Dr. Hava Blair, Researcher, Department of Soil and Environmental Sciences, UW-Madison
Related Article
Developing a Science Assessment for Wisconsin’s Nutrient Reduction Strategy